Portfolio Manager is a local-first desktop studio for the DIY investor running real, multi-account portfolios. It turns your target allocation into the exact broker-ready buy and sell orders that close the gap — across Schwab, Fidelity and beyond — then projects that portfolio all the way through retirement.
Portfolio Manager is organized around a single, repeatable flow — the same one a financial advisor follows, running entirely on your machine. The tour below mirrors the app's own sidebar, group by group.
Define what you want to own — a named allocation like a 60/40, with effective-dated versions that evolve over time.
Break the model into asset-class sleeves — U.S. Large Blend, Core Bond, International — each with a target weight.
Map each bucket to the real tickers per brokerage — FXAIX at Fidelity, SCHX at Schwab — splittable across funds.
Get the exact buy/sell orders that close the drift — then project the whole household decades into retirement.
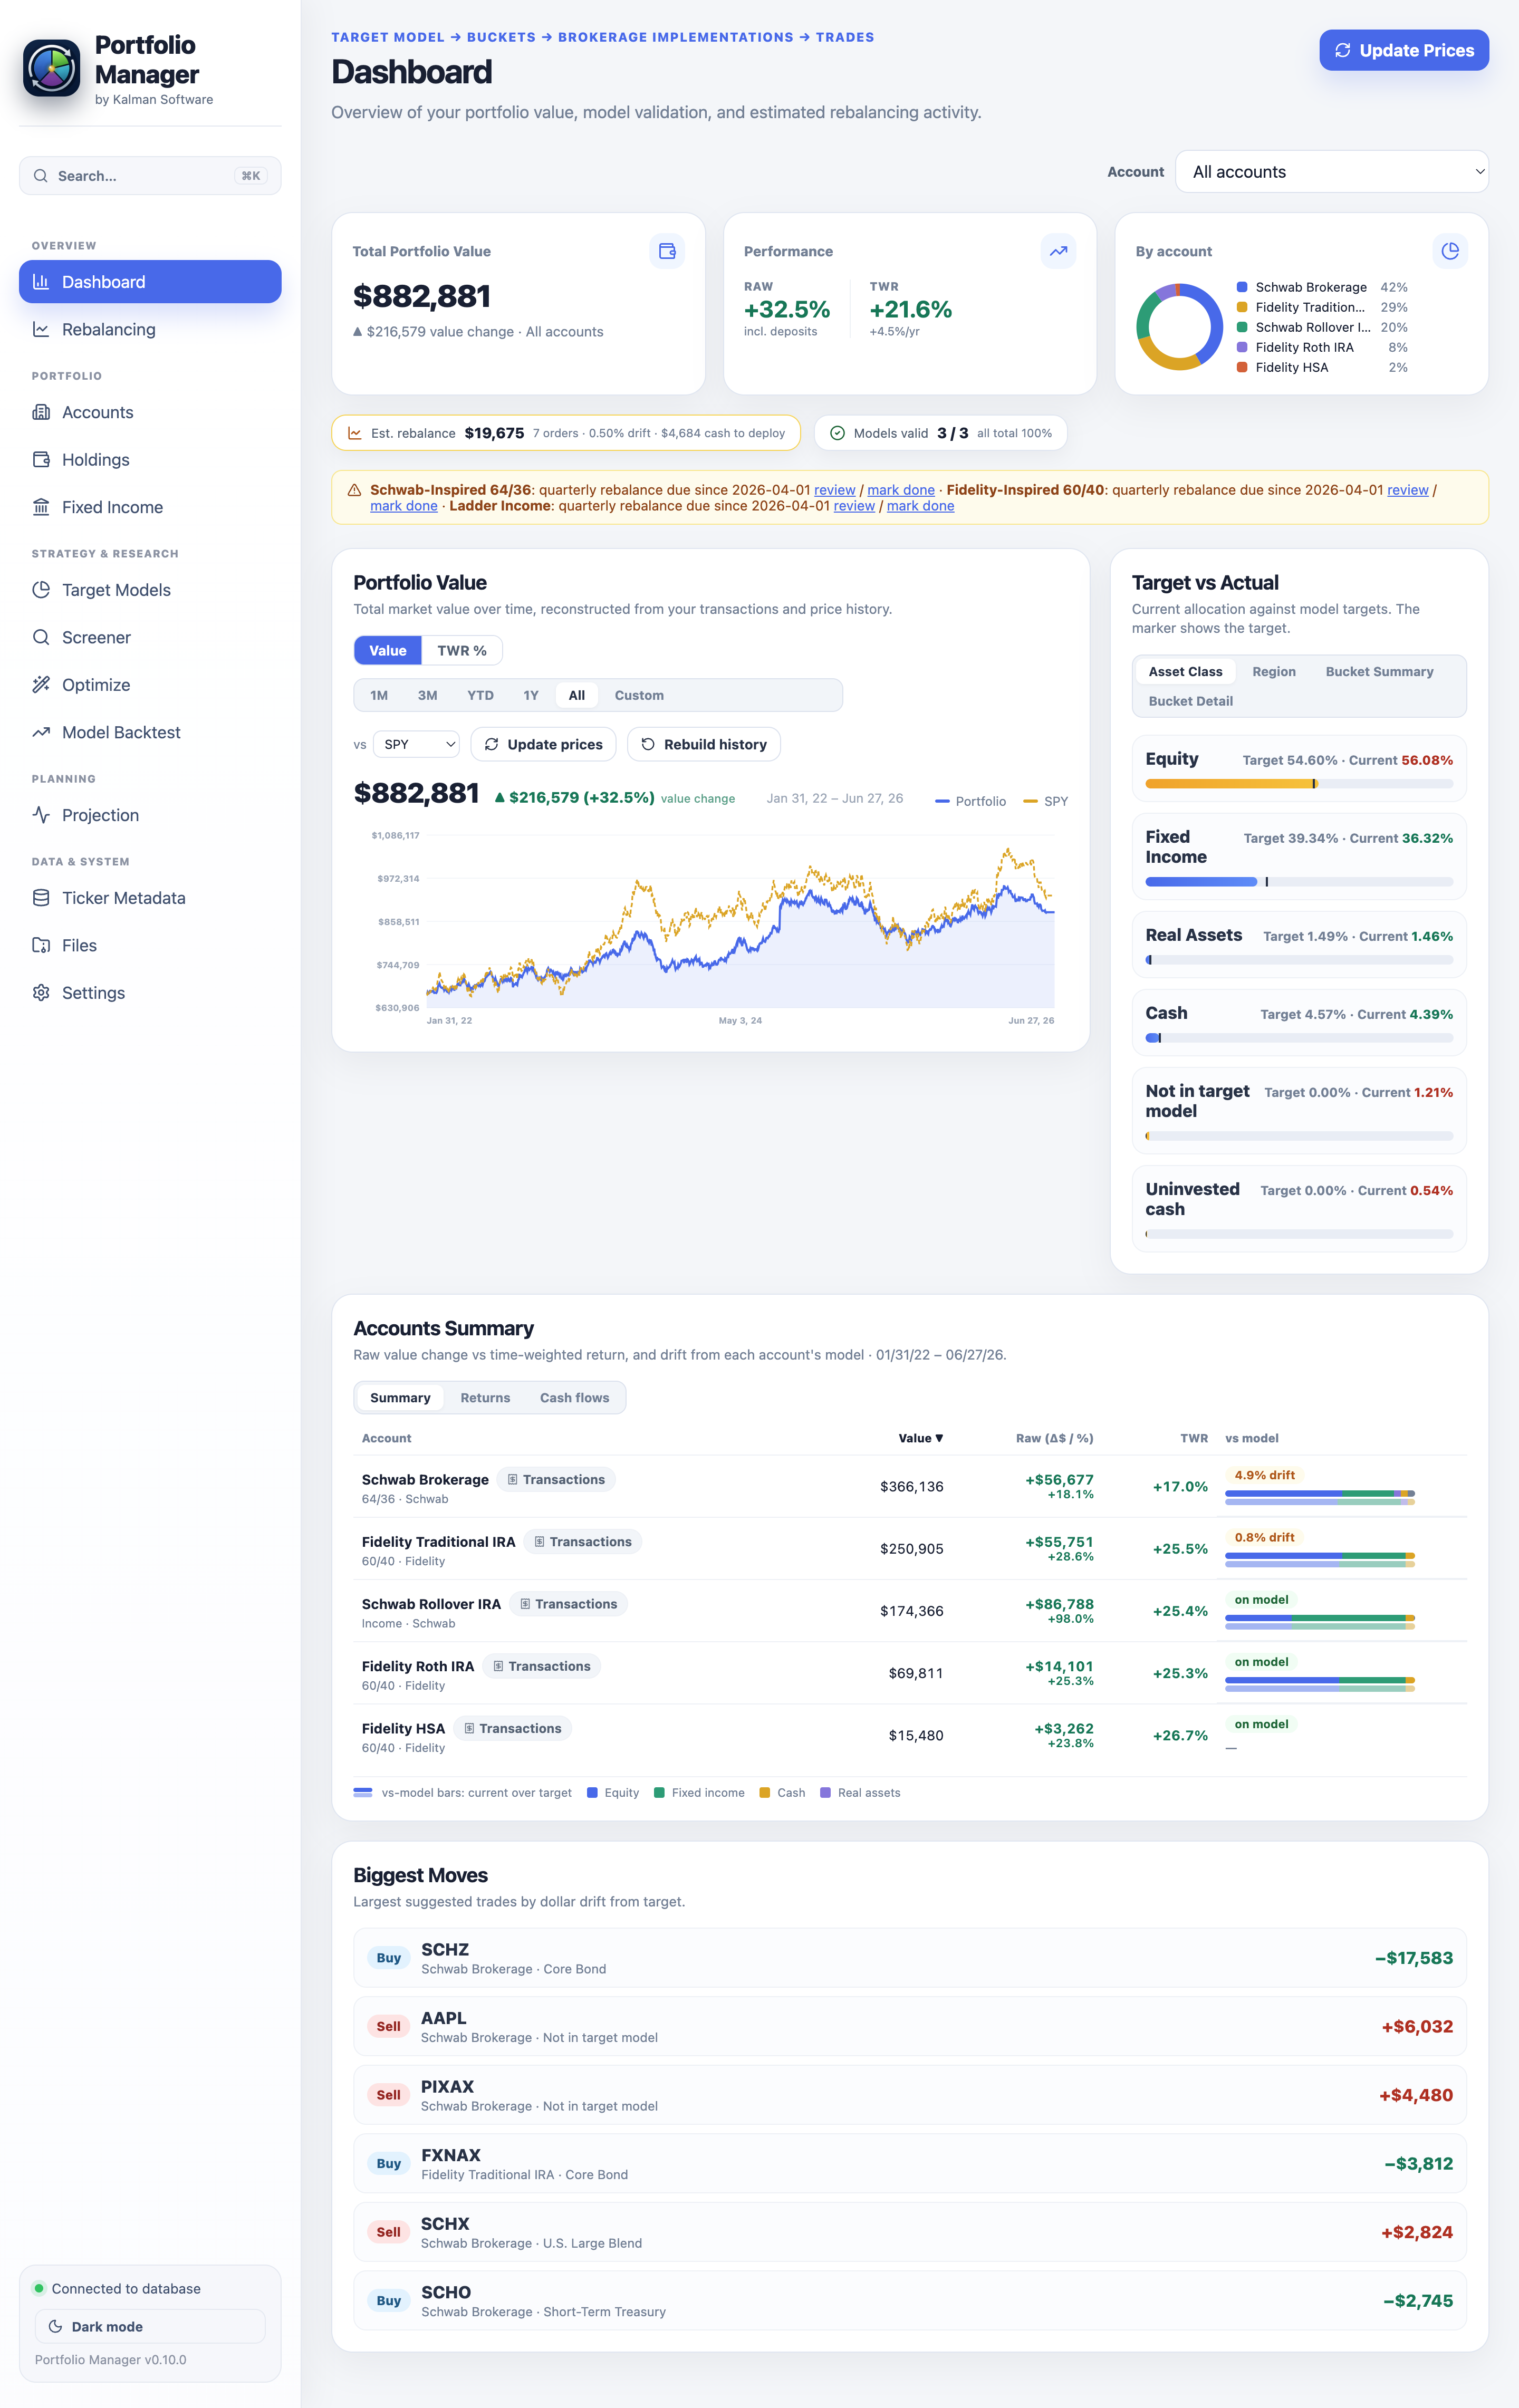
The first sidebar group is the 30-second status check — and the one action that follows from it. The Dashboard answers “where do I stand?”; Rebalancing answers “what should I do?”
Four headline cards, an account selector with saved groups, and a value chart reconstructed from your transactions and stored prices. The sample household sits at $882,881 across five accounts, with $19,675 of trades in 7 orders beyond the 0.50% drift band.
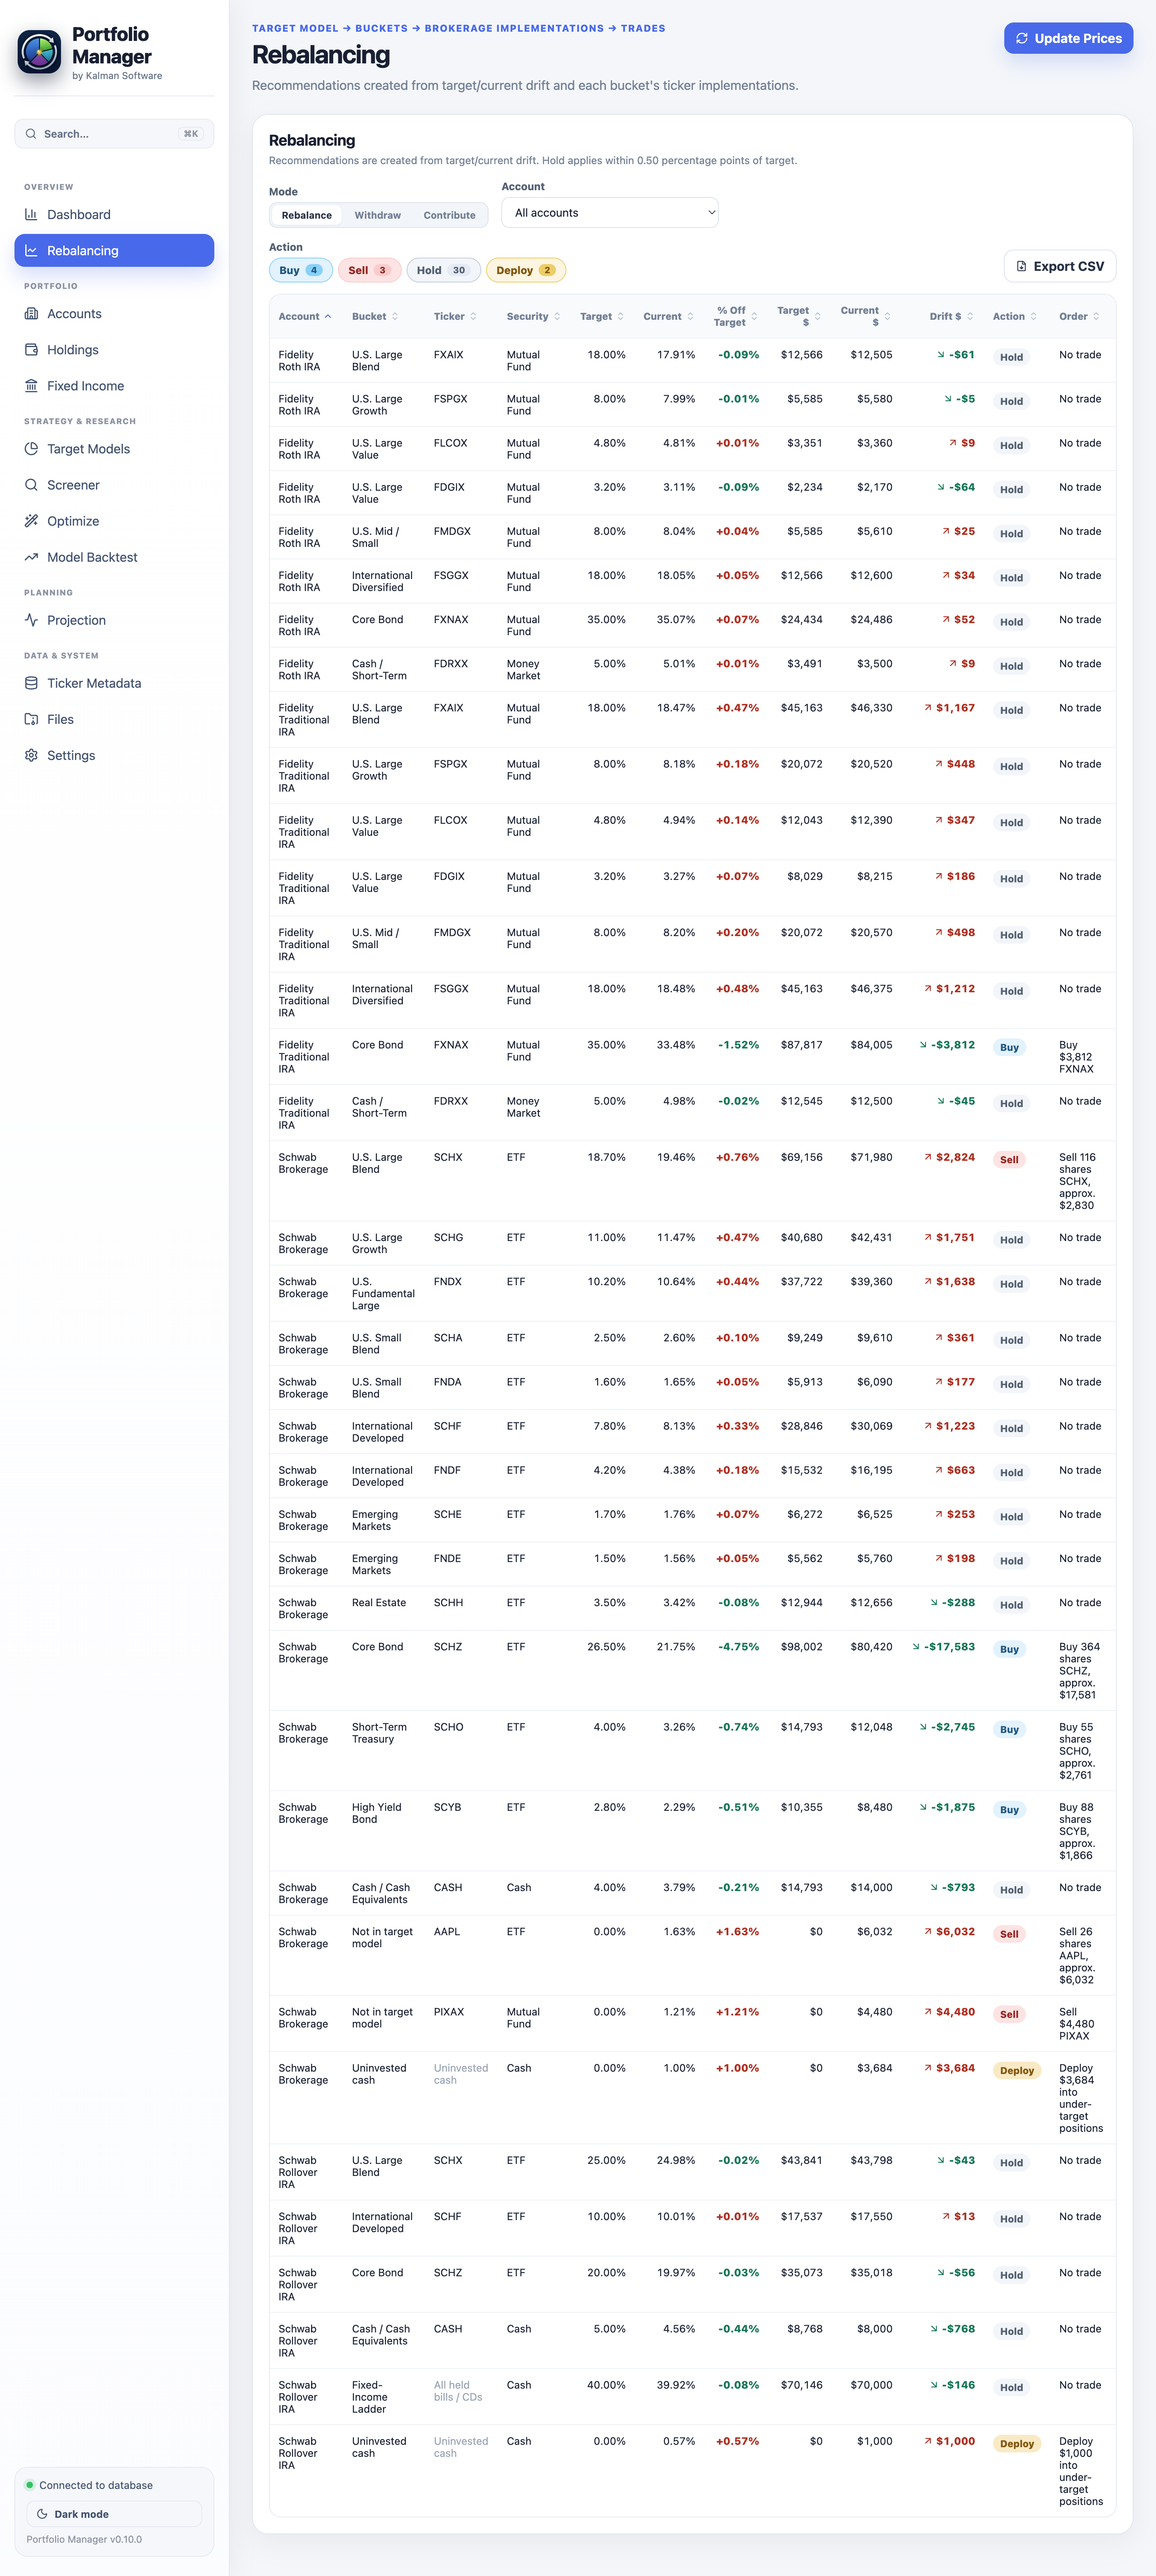
For every account, bucket and ticker, Portfolio Manager computes the drift and classifies each line Buy, Sell or Hold — anything inside your band is a Hold, no churn for noise. Then point it at a withdrawal or a contribution and the same engine becomes the exact trades that raise or invest the cash, tax-aware and lot-level.
Brokerage-aware: funds in dollars, ETFs in shares. Off-model AAPL & PIXAX queued to sell.
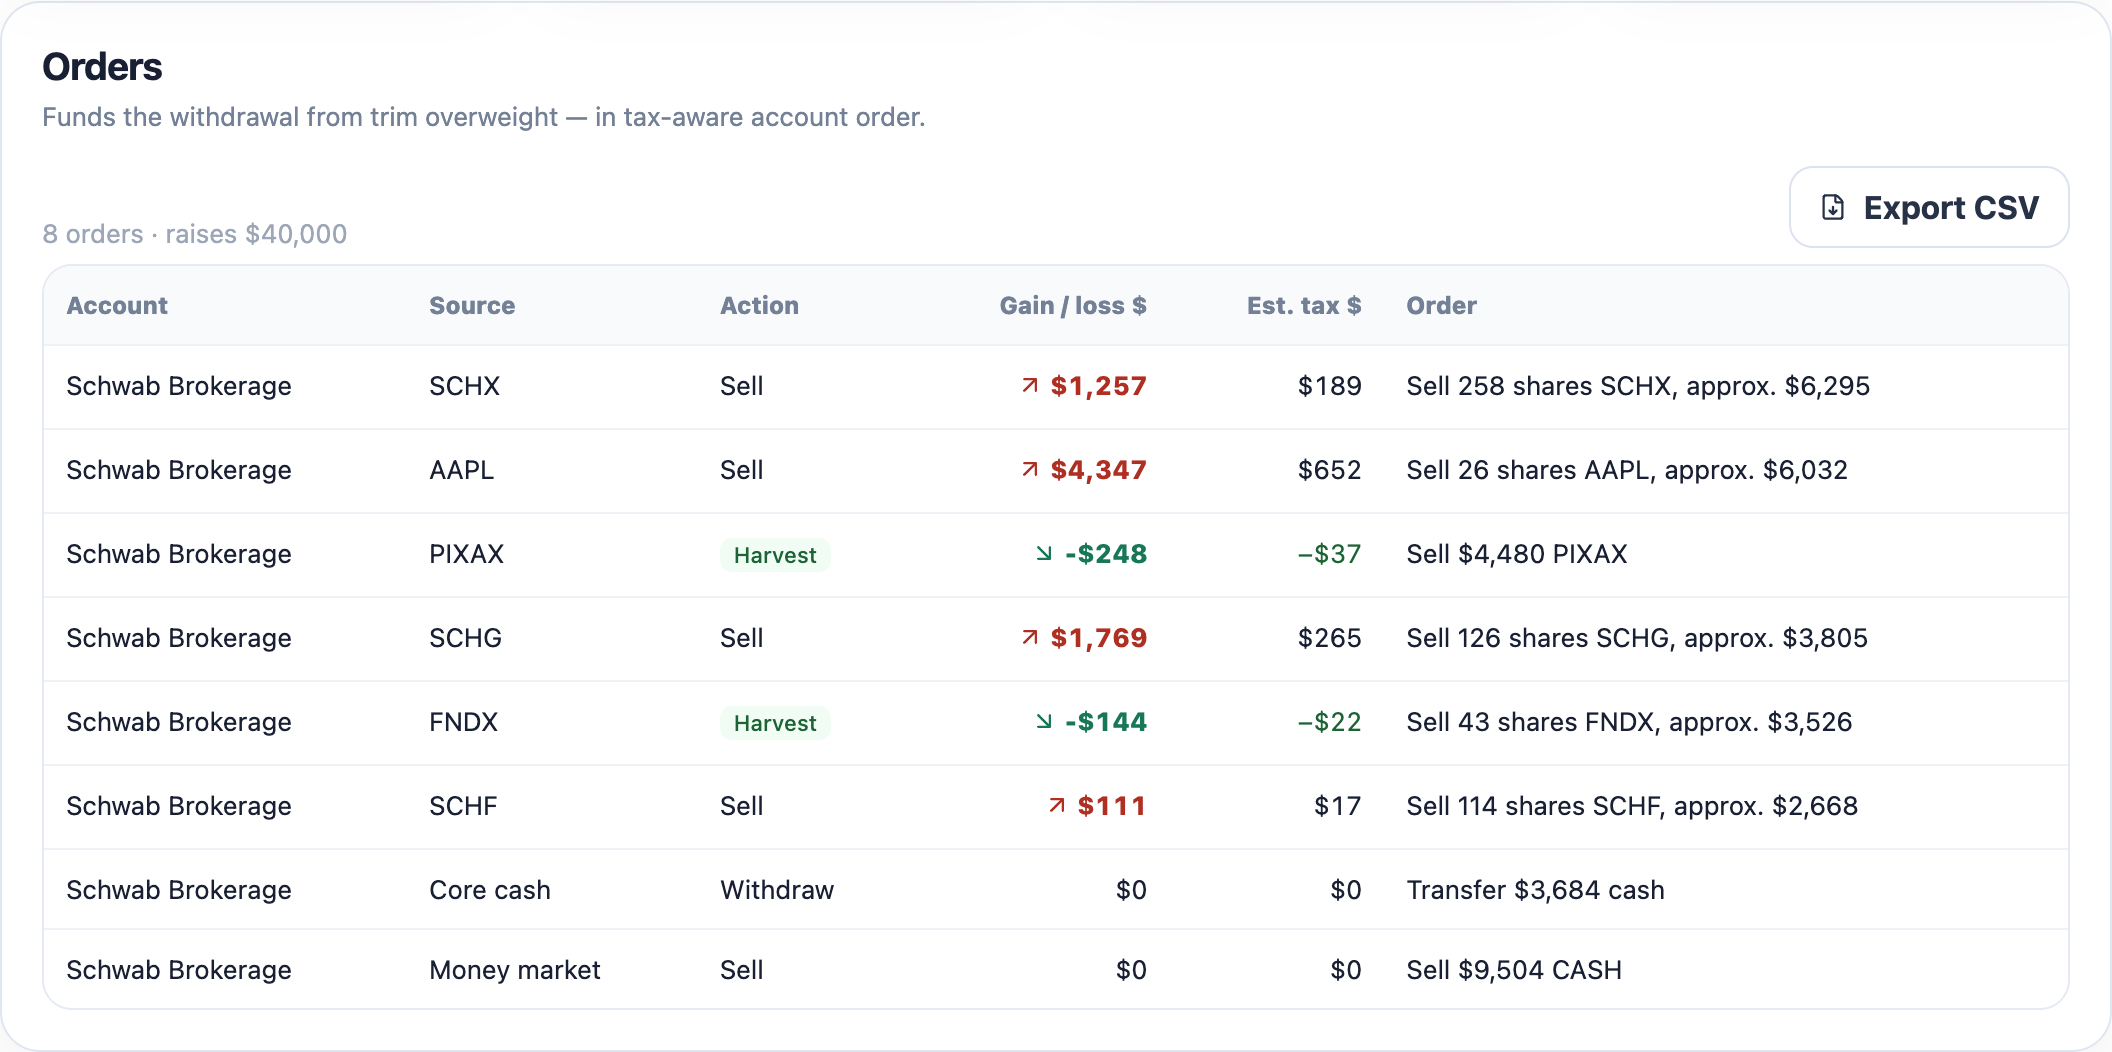
Lot-level gain/loss and estimated tax, with Harvest badges where a loss can be booked.
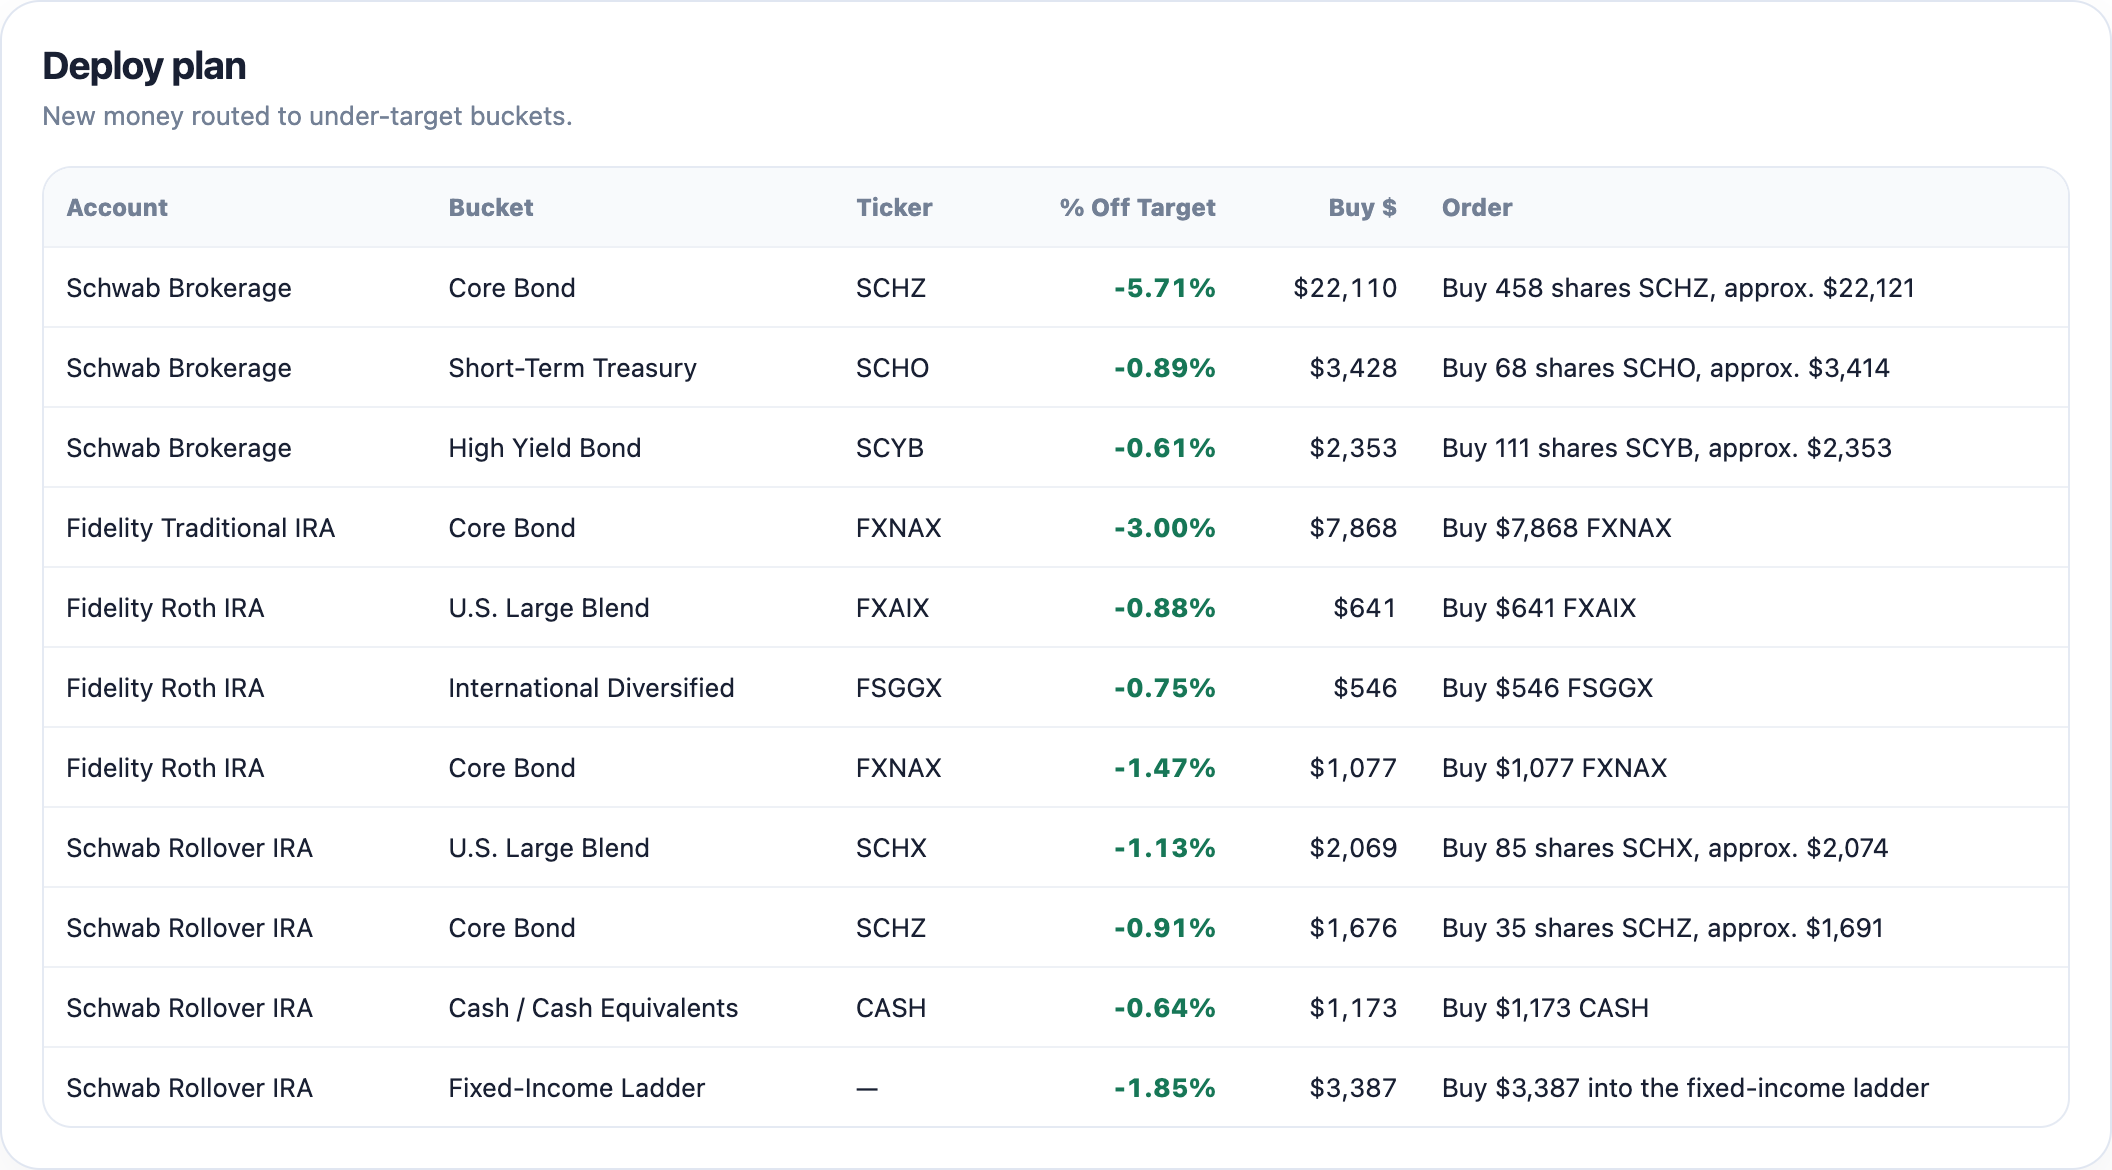
Enter new cash and the rebalance becomes a buy-only deploy plan that closes the gaps.
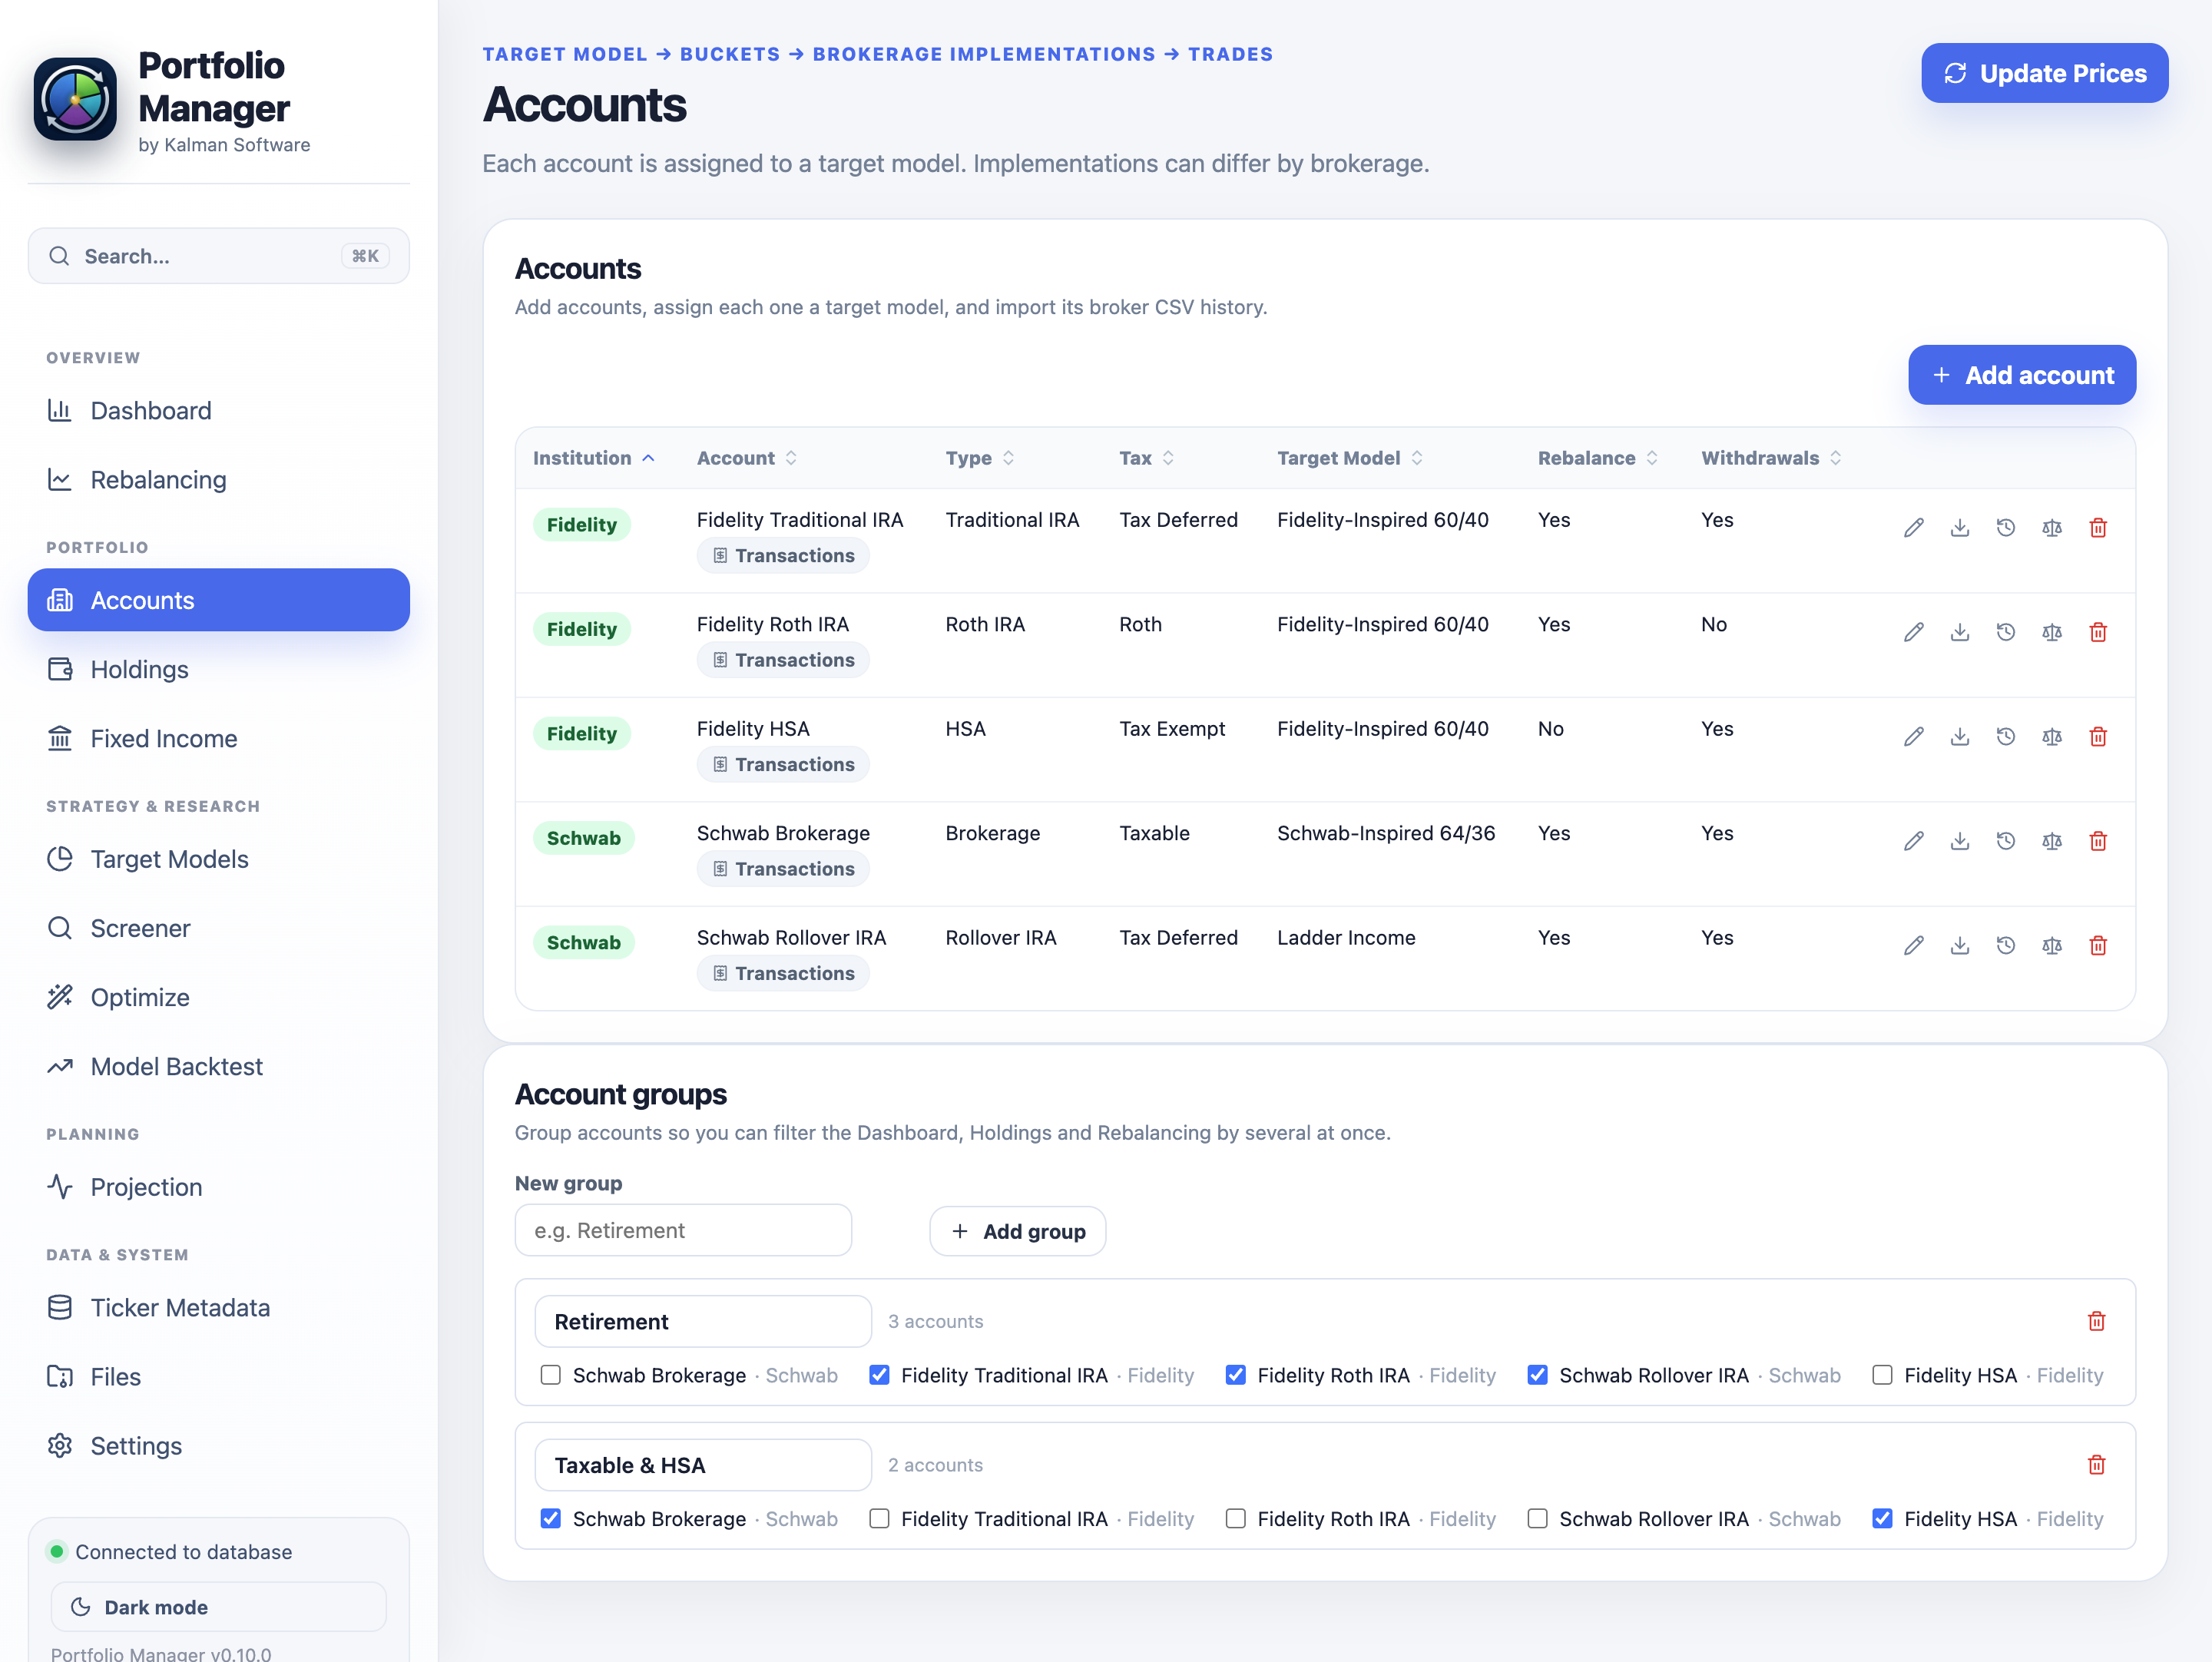
Accounts, the holdings derived from your ledger, and a fixed-income ladder priced the way bonds and CDs actually behave — the facts the math runs on.
Each row is a real brokerage account: institution, type, the tax treatment derived from it, and — the link that makes everything work — its assigned target model. The sample runs five accounts across Schwab and Fidelity.
Get your holdings in the way that suits you: hand-enter your monthly statement, or import a Schwab or Fidelity CSV. Go the transaction route and your holdings, cost basis, gains and income are all derived from the ledger — no manual share-count upkeep, and a real value history. Start from statements and upgrade to full transaction tracking whenever you're ready.
$CASH ledger per account, plus a Reconcile tool that writes the exact adjusting trade when your ledger and broker statement disagree.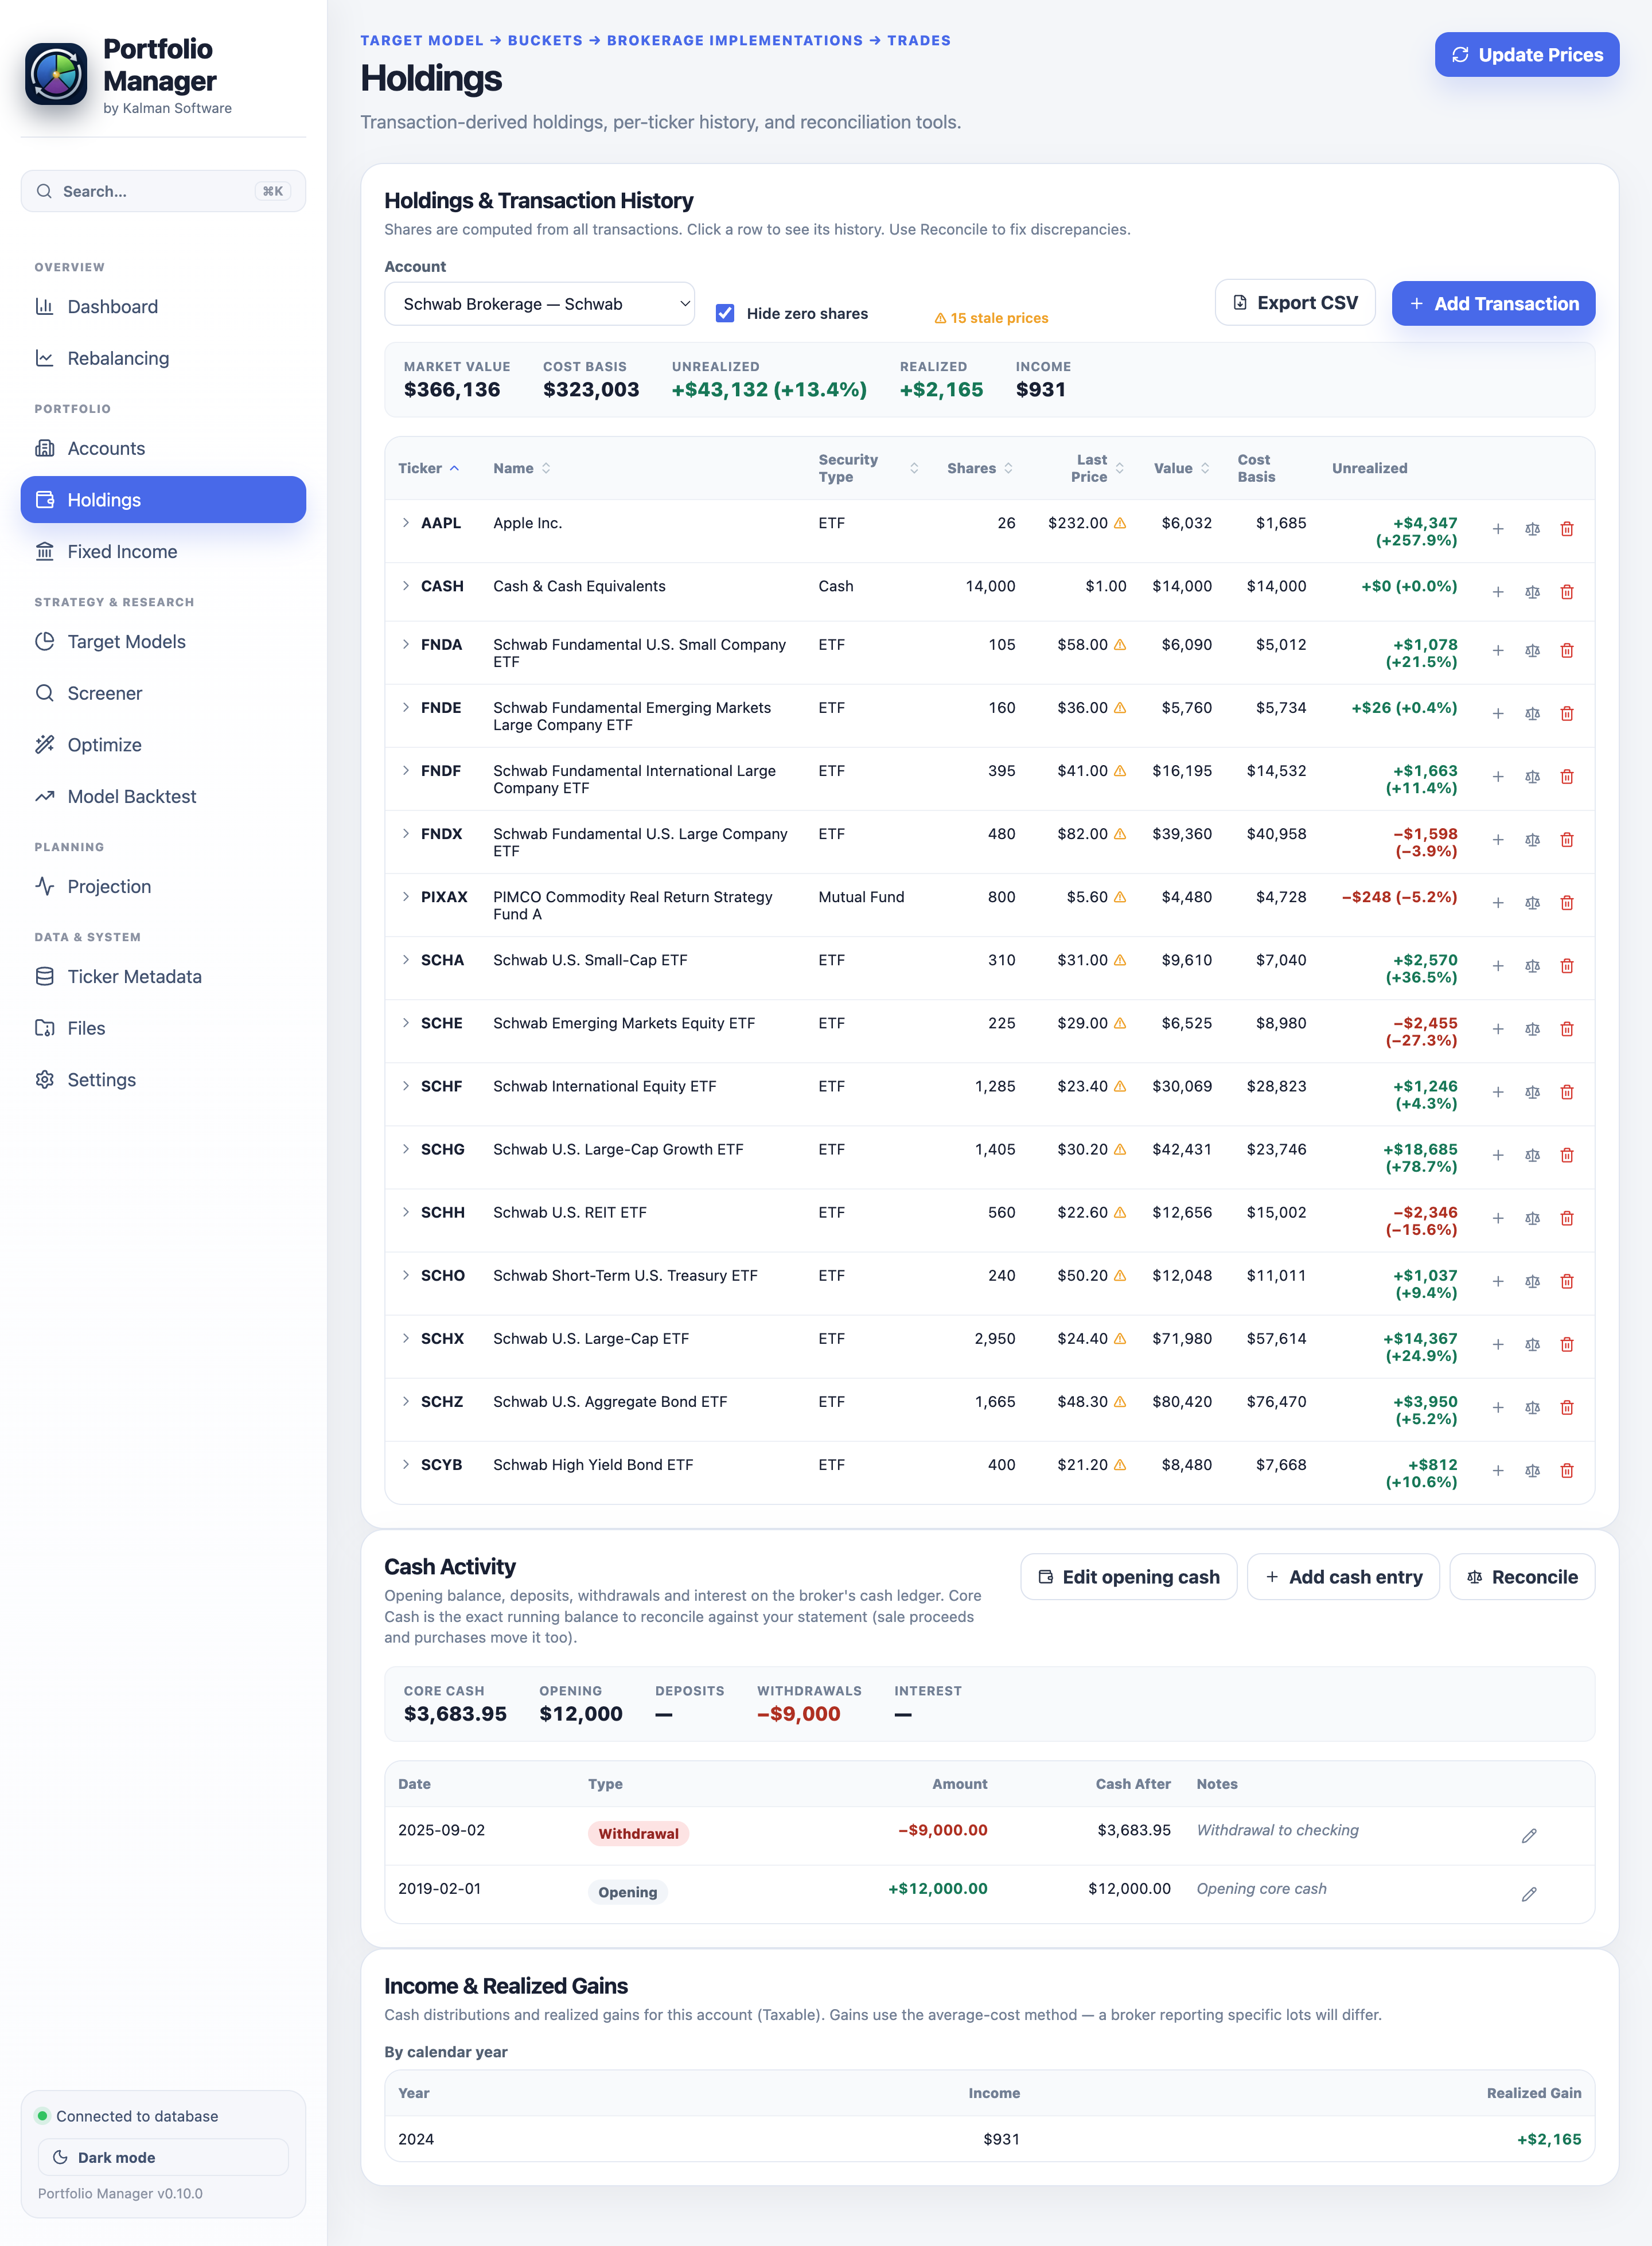
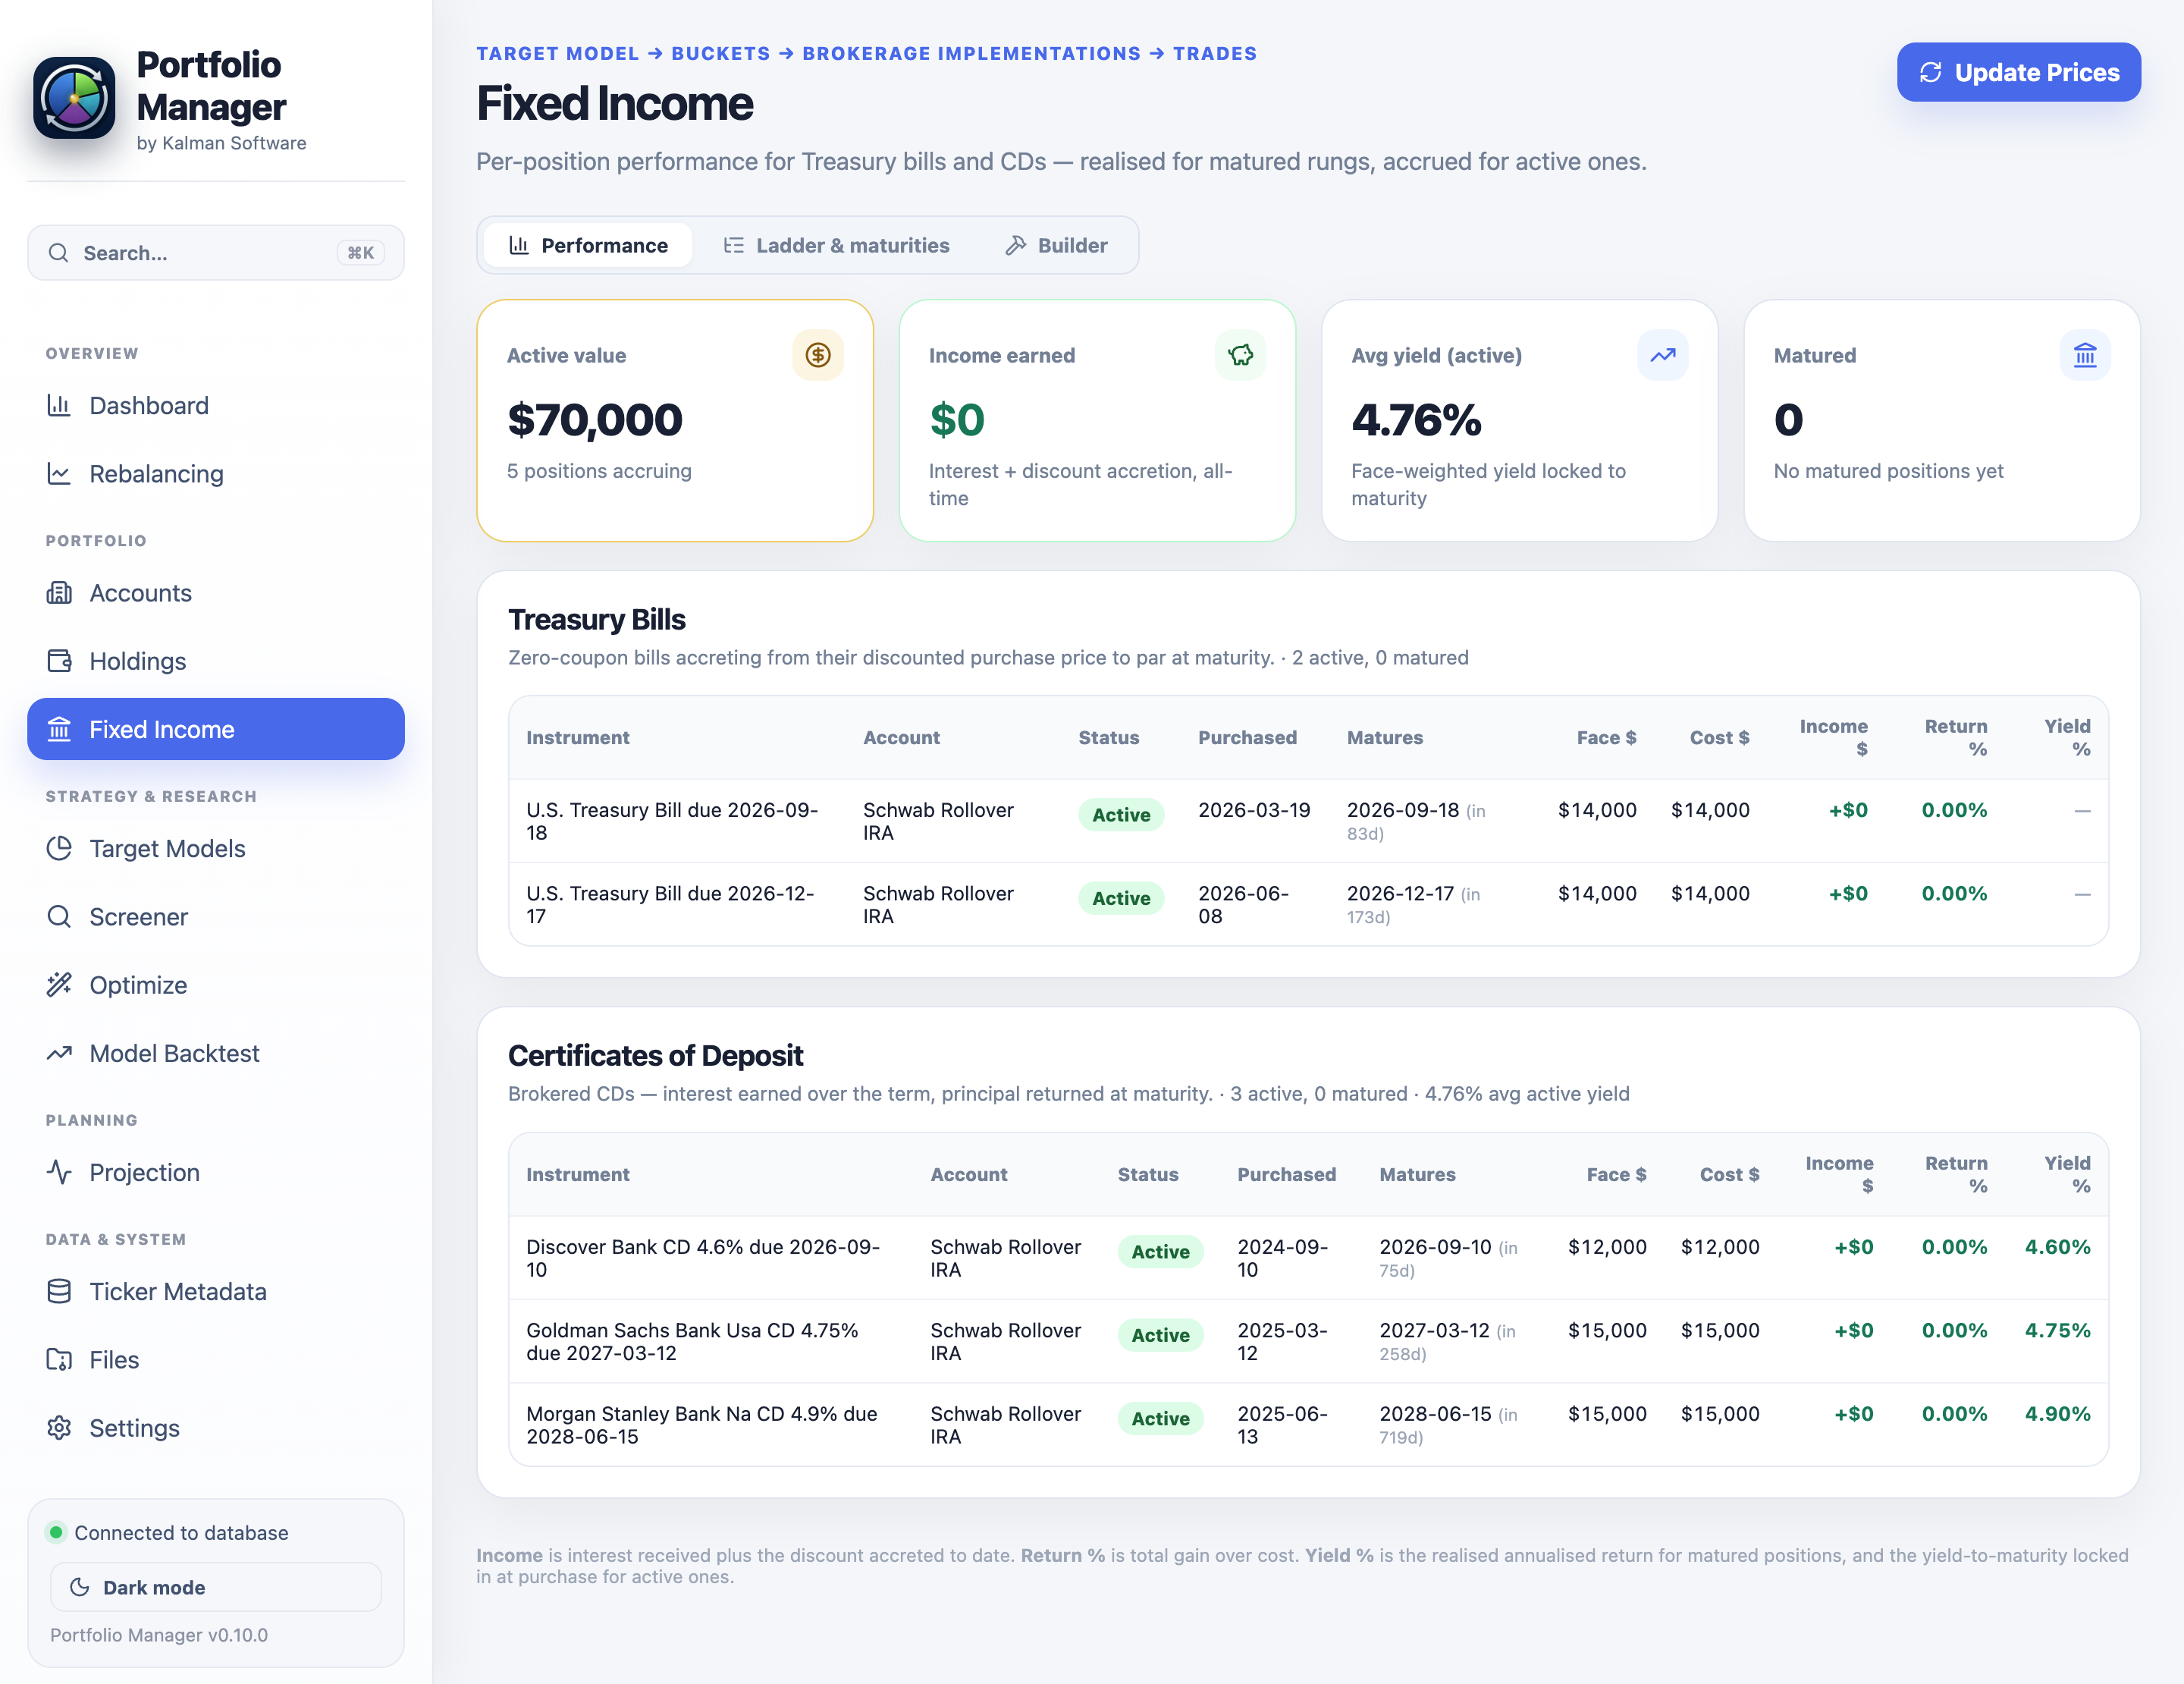
Bonds and brokered CDs don't have a price feed — they're held to maturity at par — so Portfolio Manager models them properly instead of dropping them to $0 or guessing a NAV. The in-retirement sample holds a $70,000, five-rung ladder in its Rollover IRA.
Design a model, screen the universe to fill its sleeves, let the optimizer rank substitutions on a composite score, and prove the result on a full tearsheet. This loop is life-stage-agnostic — it works the same whether you're 28 or 73.
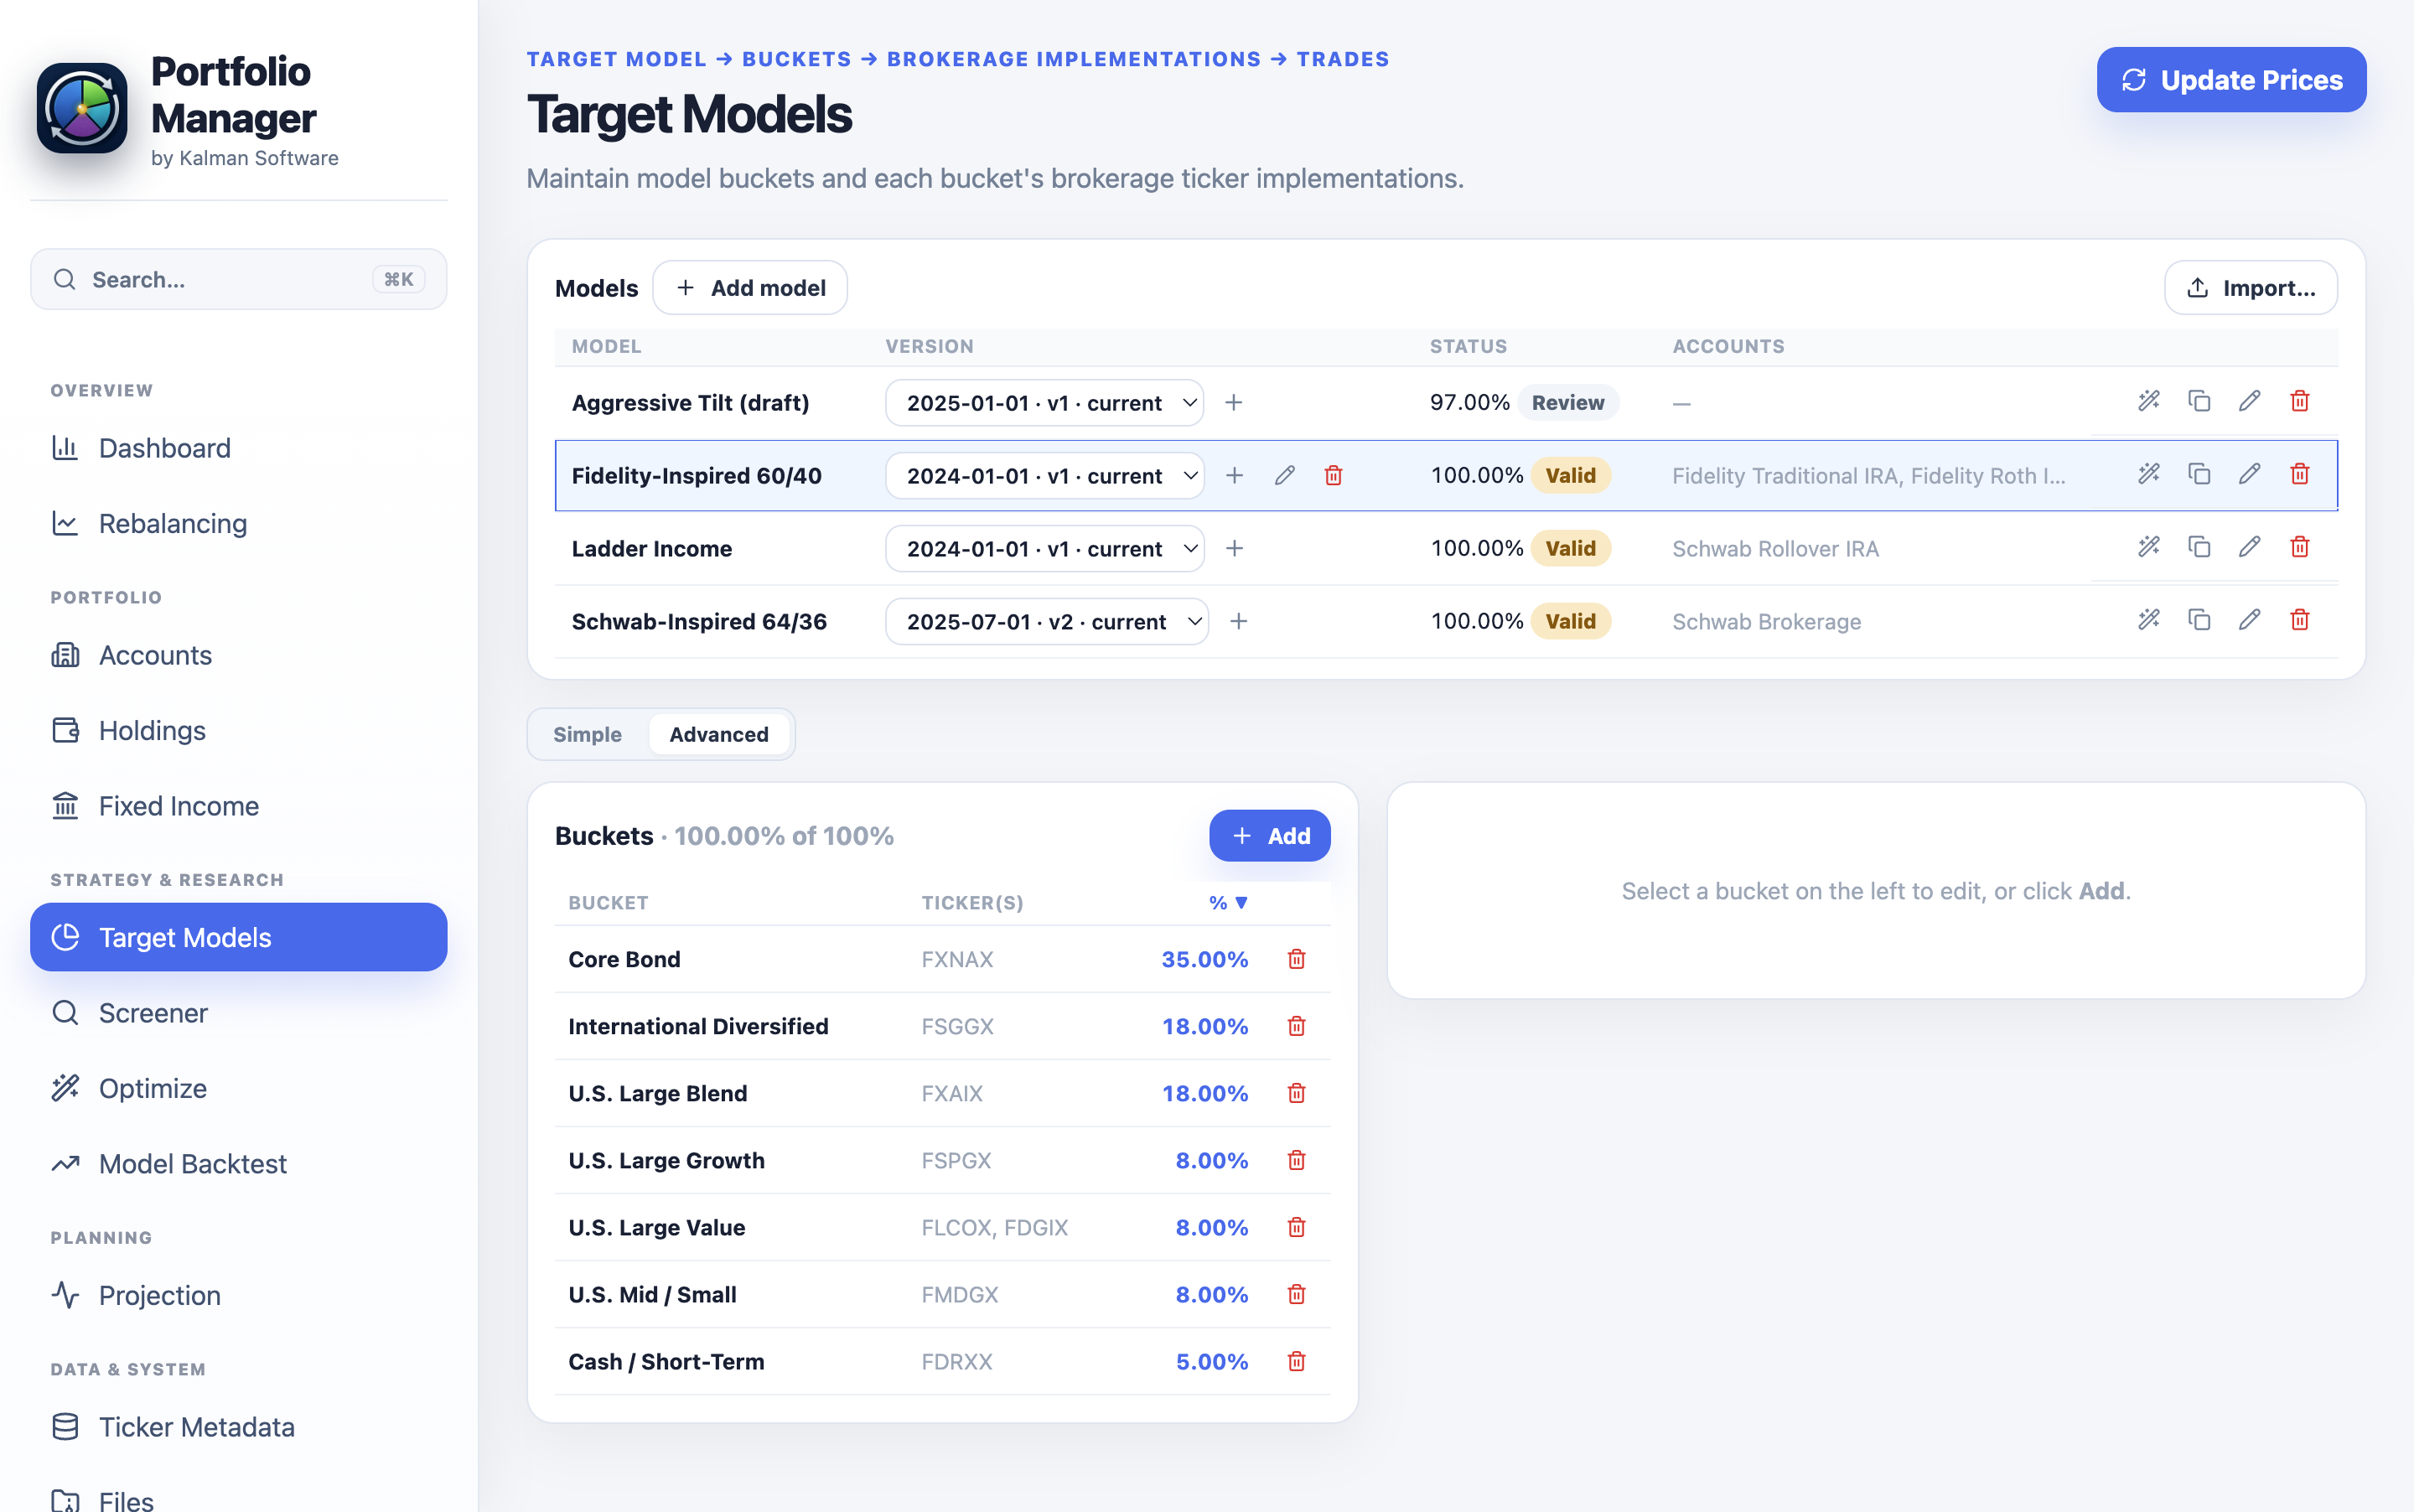
A model is buckets with target weights, and each bucket is implemented with real tickers. It's more than a spreadsheet: a live 100% budget keeps you honest, and dated versions keep your history accurate. The sample's Schwab-Inspired 64/36 totals exactly 100% and earns a green Valid badge.
Compare your whole fund universe on trailing & calendar-year returns and risk, ranked by a single tunable Score; narrow to the candidates that fit one bucket; then confirm a swap that updates the model in place. Screening and editing are one continuous motion.
Trailing & calendar returns plus 3-year risk, green-to-red, ranked by a Sharpe-like Score.
Filter to the “U.S. Large Blend” sleeve — SPY / VOO / SPLG / SCHX scored and graded Exact / Close / Broad.
“Replace SCHX with SPY in U.S. Large Blend” — set Split %, Preferred and a new name, then Swap.
The Optimizer takes the whole model and, for each bucket, ranks the substitution candidates on a composite risk/return score — with cost-vs-risk attribution that shows what you gain and what you give up. It's deterministic, so two runs are directly comparable.
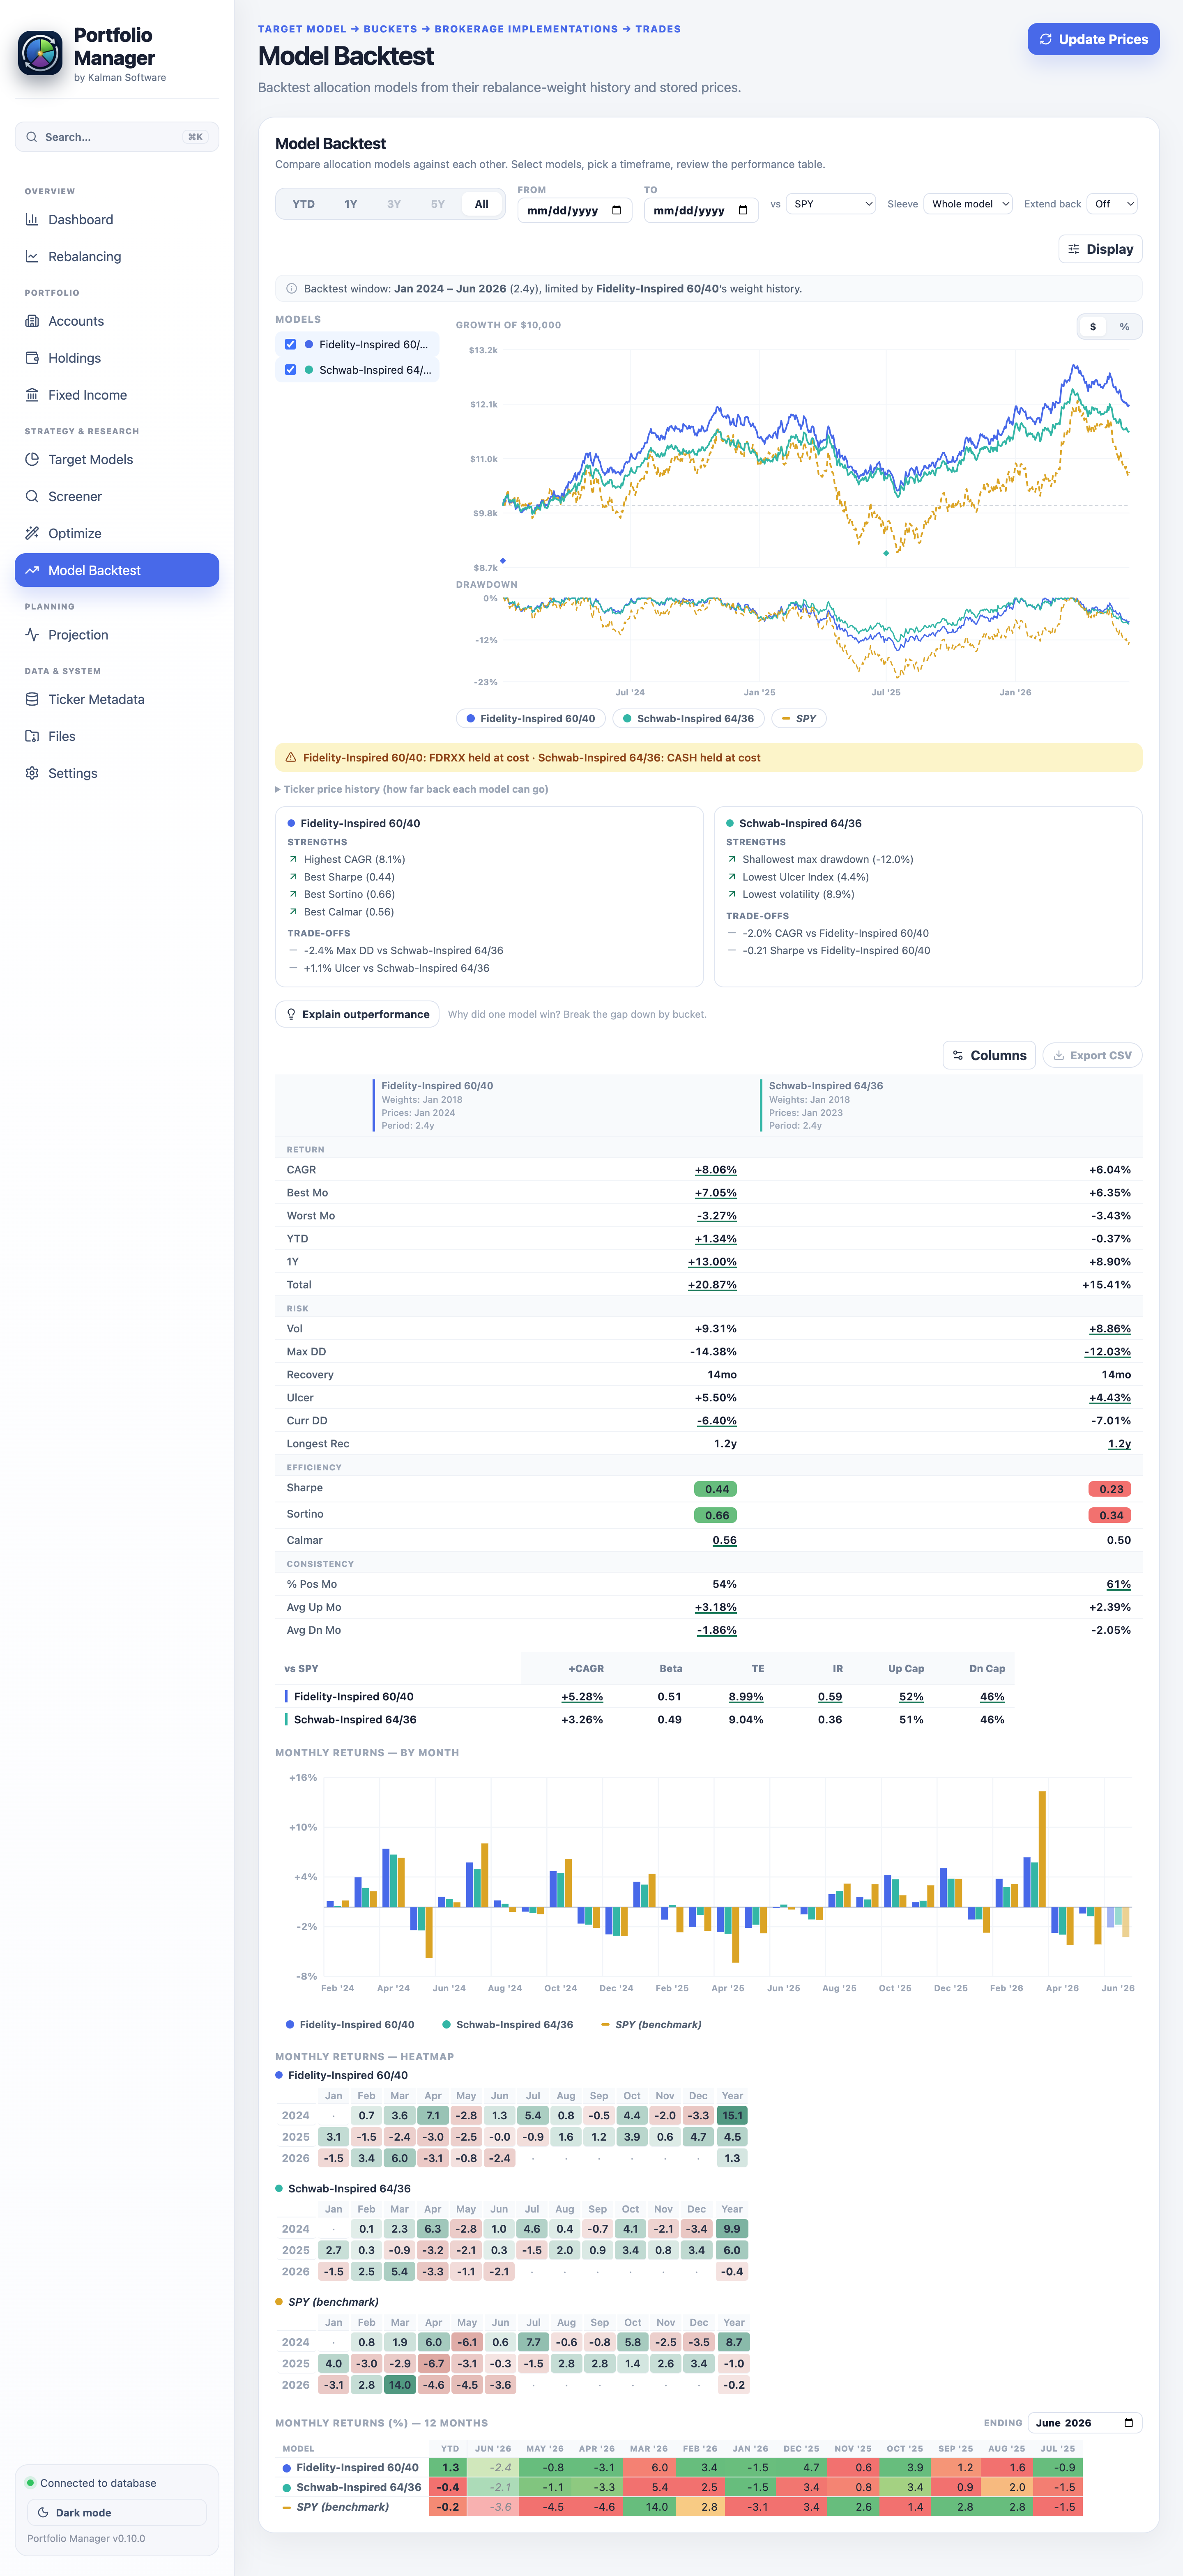
Replay one or several models over your stored price history, applying the point-in-time weights in force on each rebalance date — then read the result like a fund factsheet. Over the sample's 2018→2026 window the diversified models trail a pure-S&P benchmark, but with far lower volatility:
| Model | CAGR | Volatility | Max DD | Total |
|---|---|---|---|---|
| Fidelity-Inspired 60/40 | 5.2% | 9.6% | −14.1% | +53.8% |
| Schwab-Inspired 64/36 | 4.3% | 9.0% | −18.3% | +43.1% |
| SPY (benchmark) | 11.5% | 16.3% | −30.4% | +285.6% |
Portfolio Manager doesn't stop at "today." It runs a seeded, deterministic Monte-Carlo projection of your entire household in today's dollars — starting from your real balances split by tax class — then optimizes the levers that decide whether the money lasts: when to convert, how much house, how to flex spending, and how a survivor fares alone.
The engine models the saving years too: contributions compound into the projection, and a "when can I retire?" optimizer sweeps your retirement age to find the earliest one your plan still supports. Four sample households ship with the app — one per life stage — and switch in with a click, so you can explore each without touching your own data. Every figure below is real output from a deterministic run on these households.
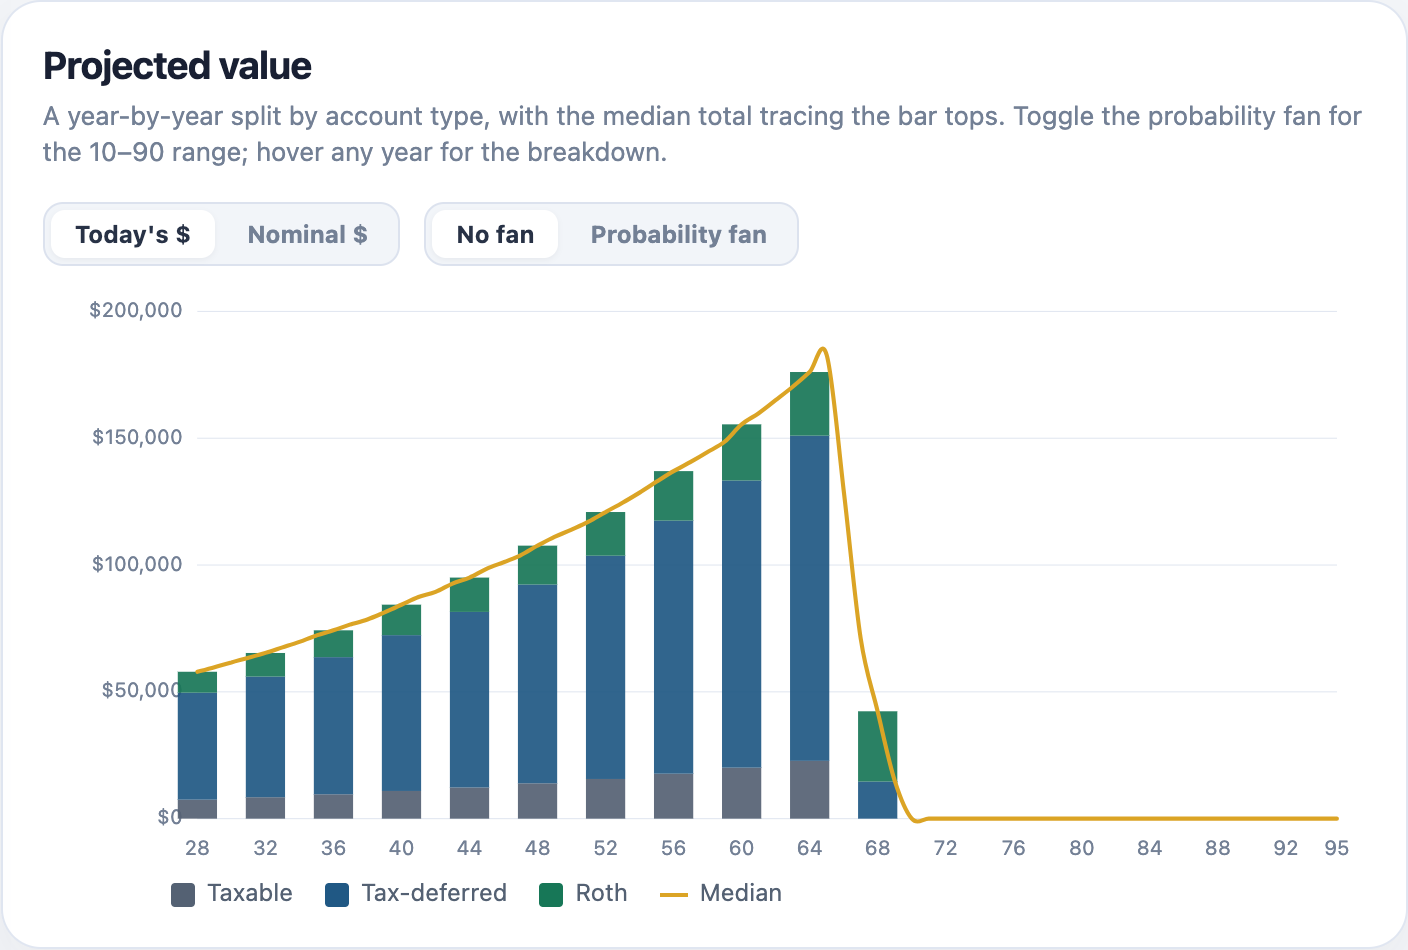
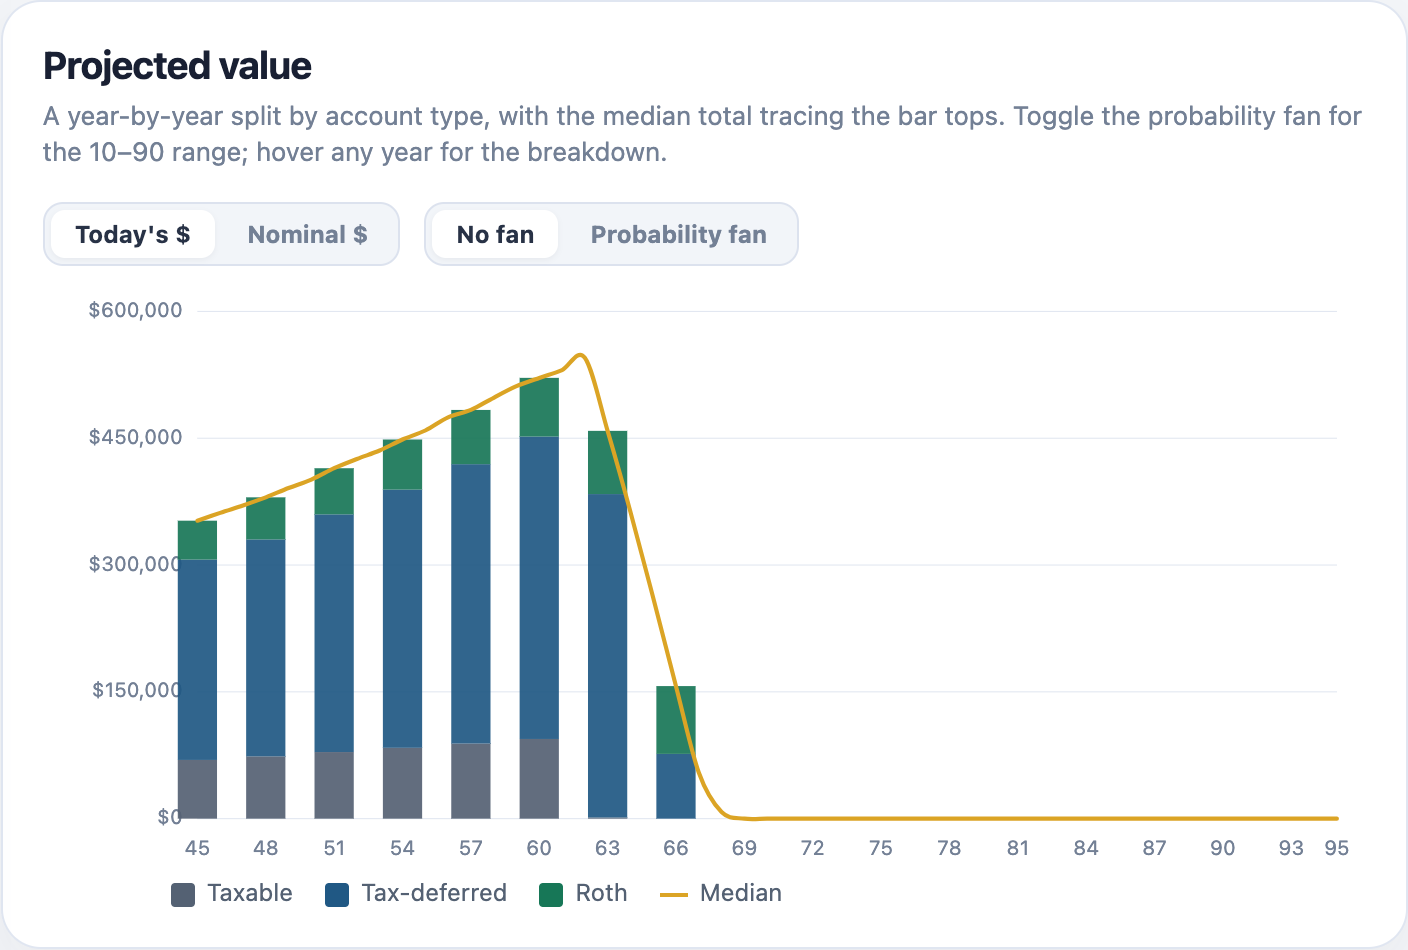
Fictional demo Four sample households (≈$58k / $352k / $883k / $1.09M) ship with the app. Every number is read from a deterministic run on these sample databases — the accumulation path and the "when can I retire?" retirement-age sweep are asserted to actually fire. The two charts are real captures of the app's projection on the early and mid samples.
Everything below is captured straight from Portfolio Manager running on a bundled sample database. Reproduce any of it: Files → load the sample → open Projection → pick the named scenario.
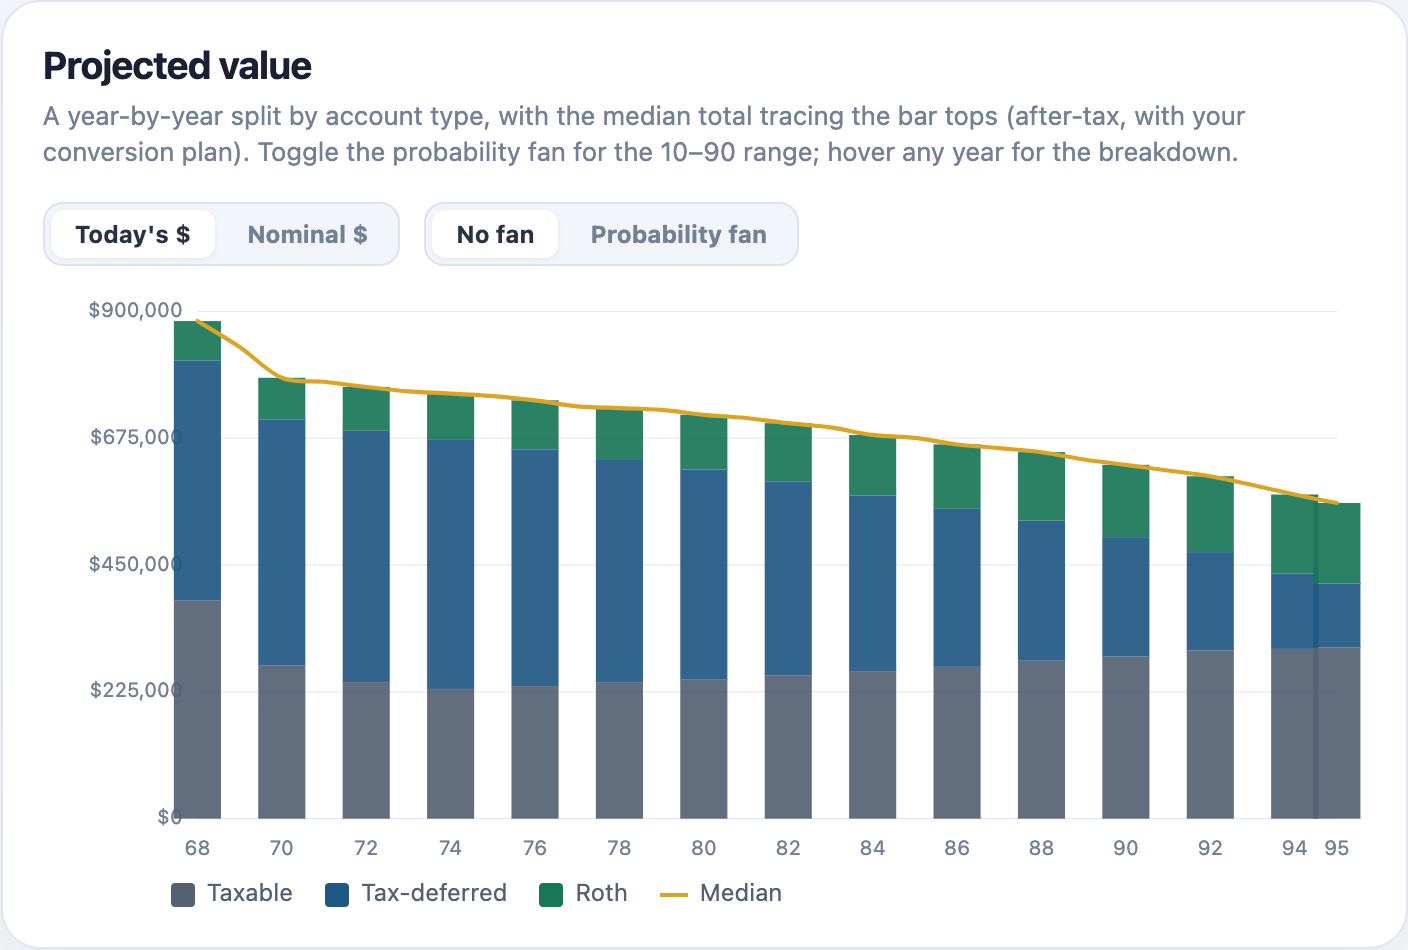
Median (line) with 25–75 and 10–90 percentile bands, today's dollars, after tax — the real engine on the Near retirement sample, “Roth conversions to age 73” scenario.
In the low-income years between retiring and RMDs, the engine fills your tax-deferred income up to a bracket you choose — every year — and re-runs the whole plan. Convert too little and RMDs balloon later; too much and you over-pay today.
Every simulated year is taxed properly, in today's dollars — so the projection knows the difference between a dollar in your IRA and a dollar in your Roth. The reference panel shows the exact brackets and thresholds the run applied.
Load the In retirement sample to see a household living on the portfolio with binding RMDs. The same engine models the levers that decide whether it lasts:
Real screenshots Every chart in this section is captured from Portfolio Manager running on a bundled sample database — load the sample, open Projection, and you'll see the same thing.
The ticker metadata that powers every rollup, the settings that tune behavior, and the local-first files you own — the parts that make the rest trustworthy.
Every ticker carries the metadata that powers classification, screening and order formatting — pulled from Yahoo Finance, with Tiingo available as a second source you can pin per ticker.
One page centralizes every knob — and the knobs are live: change the Screener's score-weights and the rankings update instantly; change a projection assumption and the next run reflects it.
It's local-first: your holdings, transactions, cost basis and plans live in a single SQLite file on your machine. No cloud to trust, nothing uploaded.
The big workflows are backed by the details that make them trustworthy.
Yahoo Finance (yfinance) for breadth, Tiingo for accuracy — set a global default or pin a source per ticker, with a clean rebuild.
Returns that neutralize your deposit/withdrawal timing — measuring the portfolio, not your cash-flow luck.
Fix a split Yahoo missed by entering a date + ratio. Pre-split closes are corrected at read time — your downloaded data is never mutated.
Bulk-load Fidelity/Schwab fund lists for no-transaction-fee flags, expense ratios and Morningstar star ratings.
Automatic backups on launch with a configurable keep-count, plus on-demand backup, restore and delete — all timestamped.
One portable SQLite file on your machine. No account, no login, no cloud. Move it to a synced folder or external drive anytime.
Effective-dated model versions drive today's trades and yesterday's backtests — duplicate, edit, and roll forward, with every change a diamond marker on the backtest chart.
Enter your broker's actual share count and Portfolio Manager writes the exact adjusting trade to make the ledger agree.
Dial the screener's period weights, risk-free rate, expense drag and risk penalties — and watch the rankings update instantly.
For accounts you don't import trade-by-trade, store periodic stated holdings — Portfolio Manager values them and computes return with a Modified-Dietz net-flow.
The projection engine isn't one bell curve: multi-asset glide paths, Student-t fat tails, real historical-sequence replay, and AR(1) inflation — each calibrated and tested.
Every projection is reproducible from a seed, so an optimizer's two runs share the same market paths — a fair, paired comparison, never sampling noise.
| Capability | Typical portfolio tracker | Portfolio Manager |
|---|---|---|
| The output | “You're overweight equities” | “Buy SCHZ in whole shares to top up bonds; sell the AAPL that isn't in your model” |
| Accounts & brokerages | One account, one number | Five accounts, two brokerages, four models — one household |
| Performance math | Returns skewed by your deposits | True time-weighted return |
| Choosing a fund | Guesswork | Risk-adjusted, tunable scoring across your universe, plus a composite-score optimizer |
| Bonds & CDs | Ignored, or marked to $0 | A real T-bill/CD ladder priced by accrual, counted in rebalancing |
| Backtesting | One growth curve, if that | A tearsheet: benchmark stats, drawdowns, monthly returns, honest windows |
| Retirement | Not its job | Seeded Monte-Carlo of your whole household, in today's dollars |
| Planning depth | A 4%-rule calculator, maybe | Real taxes, per-owner RMDs, Roth-conversion & affordability optimizers, a spending guardrail, and a survivorship (widow's-penalty) model |
| Your data | On someone else's server | Local-first SQLite, backups you own |
Local-first by design. Your holdings, transactions, cost basis and plans are computed on your own machine and live in a single file you can read, move, and back up — never on someone else's server.
Every calculation runs on your Mac. No server ever sees your accounts, balances or plans.
Open it and go. No sign-up, no cloud profile, no telemetry phoning home.
Everything lives in a single SQLite file — move it to a synced folder or external drive and keep your own timestamped backups. Zero lock-in.
TWR, average-cost basis, Sharpe/Sortino/Calmar and the optimizer's score are tested, reproducible math — not a black box. Built with Electron, React, Python & SQLite.
No — and that's by design. You import a CSV transaction export from Fidelity or Schwab, and Portfolio Manager hands you orders to place yourself. It never has your login, never moves money, and never places a trade. You stay fully in control.
In a single SQLite file on your own machine. There's no cloud, no account, and no telemetry. You can see exactly where the file lives, move it to a synced folder or external drive, and keep automatic timestamped backups.
The transaction CSV importer auto-detects Fidelity and Schwab formats, and brokerage-aware ordering plus NTF (no-transaction-fee) filtering cover Fidelity, Schwab and Vanguard. The model layer itself is brokerage-agnostic — you can implement the same target with whatever tickers you hold.
A Python yfinance sidecar pulls adjusted price history and fund profiles from Yahoo Finance, and Tiingo is available as a second source you can pin per ticker. “Update prices” grabs only the missing recent days; “Rebuild” re-downloads from scratch.
It's a risk-adjusted, Sharpe-like ranking: a blended multi-period return clears a risk-free hurdle, is divided by volatility, shrunk by how much history backs it, and penalized for expense ratio, max drawdown and year-to-year inconsistency. Every weight is tunable on the Settings page and updates the screener instantly. The Optimize page then uses the same composite scoring to rank substitution candidates across every bucket at once.
They apply the model-weight version that was in force on each rebalance date, hold cash sleeves flat instead of redistributing them, and state the true common window and what limits it — presets the data can't cover are disabled, not silently truncated. If you extend a backtest before a model's first version date, the banner discloses the extrapolation, and every statistic — metrics table, benchmark comparison, monthly views — follows the window the chart shows.
Yes — overlay any ticker, or one of your other models, as a dashed line on the equity chart; it joins the drawdown panel and the crosshair tooltip too. A dedicated table reports excess CAGR, beta, tracking error, information ratio and up/down capture for each model, and a default benchmark set once in Settings applies to both the Dashboard and the Backtest.
Yes — this is the other half of the app. The Projection runs a seeded Monte-Carlo simulation of your whole household in today's dollars, starting from your real balances by tax class. It models spending phases, Social Security, one-time flows, taxes (federal brackets, a flat state rate, the Social-Security provisional worksheet, ACA/IRMAA ceilings) and per-owner RMDs. On top of that sit the optimizers: a fill-to-bracket Roth-conversion frontier, a home-purchase planner with an affordability frontier and best-payoff-year sweep, a Guyton-Klinger spending guardrail, and a deterministic survivorship model that flips your filing to Single at the first death so you can see the widow's penalty.
Deliberately so. The engine runs in today's (real) dollars, so Social Security and tax brackets are treated as inflation-indexed rather than double-counted. It's seeded and deterministic, so two runs are directly comparable and an optimizer's choices aren't sampling noise. The tax model is ordinary-income only — no long-term-capital-gains or NIIT stack — a documented simplification, not a hidden one. And where a number can't be made perfectly precise, the app says so rather than implying false confidence — the guardrail even reports the spending cuts behind any success-rate lift.
Held-to-maturity Treasuries, brokered CDs and bonds are tracked in a Fixed Income view and priced by accrual toward par, so they don't create false dips on your value chart. You get a ladder layout with issuer (FDIC) exposure and a forward income calendar, plus a Builder that models a target ladder off the live Treasury par-yield curve. A model's ladder bucket counts every held rung in rebalancing automatically.
Design the portfolio you want, see the one you have, and get the trades that close the gap — entirely on your own machine.
Made by Kalman Software — indie, local-first, no VC, no data harvesting.